RBS 2014 Annual Report Download - page 146
Download and view the complete annual report
Please find page 146 of the 2014 RBS annual report below. You can navigate through the pages in the report by either clicking on the pages listed below, or by using the keyword search tool below to find specific information within the annual report.-
 1
1 -
2
-
3
-
4
-
5
-
6
-
7
-
8
-
9
-
10
-
11
-
12
-
13
-
14
-
15
-
16
-
17
-
18
-
19
-
20
-
21
-
22
-
23
-
24
-
25
-
26
-
27
-
28
-
29
-
30
-
31
-
32
-
33
-
34
-
35
-
36
-
37
-
38
-
39
-
40
-
41
-
42
-
43
-
44
-
45
-
46
-
47
-
48
-
49
-
50
-
51
-
52
-
53
-
54
-
55
-
56
-
57
-
58
-
59
-
60
-
61
-
62
-
63
-
64
-
65
-
66
-
67
-
68
-
69
-
70
-
71
-
72
-
73
-
74
-
75
-
76
-
77
-
78
-
79
-
80
-
81
-
82
-
83
-
84
-
85
-
86
-
87
-
88
-
89
-
90
-
91
-
92
-
93
-
94
-
95
-
96
-
97
-
98
-
99
-
100
-
101
-
102
-
103
-
104
-
105
-
106
-
107
-
108
-
109
-
110
-
111
-
112
-
113
-
114
-
115
-
116
-
117
-
118
-
119
-
120
-
121
-
122
-
123
-
124
-
125
-
126
-
127
-
128
-
129
-
130
-
131
-
132
-
133
-
134
-
135
-
 136
136 -
 137
137 -
 138
138 -
 139
139 -
 140
140 -
 141
141 -
 142
142 -
 143
143 -
 144
144 -
 145
145 -
 146
146 -
 147
147 -
 148
148 -
 149
149 -
 150
150 -
 151
151 -
 152
152 -
 153
153 -
 154
154 -
 155
155 -
 156
156 -
157
-
158
-
159
-
160
-
161
-
162
-
163
-
164
-
165
-
166
-
167
-
168
-
169
-
170
-
171
-
172
-
173
-
174
-
175
-
176
-
177
-
178
-
179
-
180
-
181
-
182
-
183
-
184
-
185
-
186
-
187
-
188
-
189
-
190
-
191
-
192
-
193
-
194
-
195
-
196
-
197
-
198
-
199
 |
 |

11
RBS – Interim Results 2015
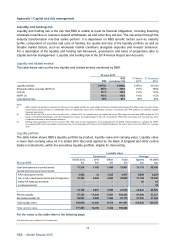
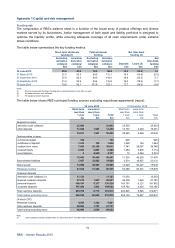
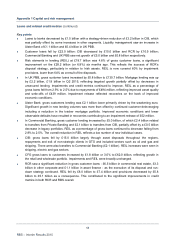
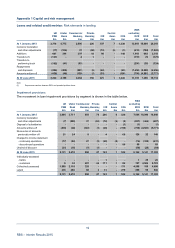
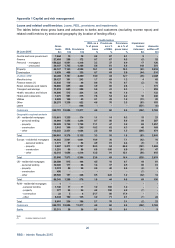
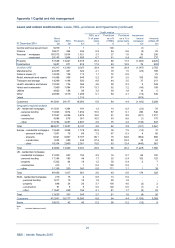
Appendix 1 Capital and risk management
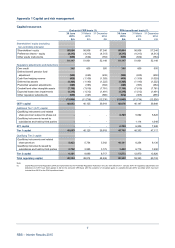
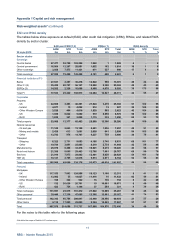
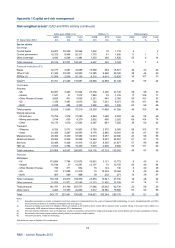
Risk-weighted assets* (continued)
EAD and RWA density
The tables below show exposure at default (EAD) after credit risk mitigation (CRM), RWAs, and related RWA
density by sector cluster.
EAD post CRM (1,2) RWAs (1) RWA density
AIRB STD Total AIRB STD Total AIRB STD Total
30 June 2015 £m £m £m £m £m £m % % %
Sector cluster
Sovereign
Central banks 47,477 55,729 103,206 1,868 11,869 4 -2
Central government 16,564 12,287 28,851 1,652 162 1,814 10 16
Other sovereign 3,958 7,473 11,431 671 327 998 17 49
Total sovereign 67,999 75,489 143,488 4,191 490 4,681 6 13
Financial institutions (FI)
Banks 27,831 2,387 30,218 12,822 569 13,391 46 24 44
Other FI (2) 35,420 20,727 56,147 15,982 9,380 25,362 45 45 45
SSPEs (3) 14,282 2,326 16,608 5,480 4,078 9,558 38 175 58
Total FI 77,533 25,440 102,973 34,284 14,027 48,311 44 55 47
Corporates
Property
- UK 42,808 3,493 46,301 21,824 3,478 25,302 51 100 55
- Ireland 4,077 15 4,092 912 15 927 22 100 23
- Other Western Europe 3,526 484 4,010 1,520 503 2,023 43 104 50
- US 1,036 8,024 9,060 519 8,059 8,578 50 100 95
- RoW 1,639 361 2,000 1,115 335 1,450 68 93 73
Total property 53,086 12,377 65,463 25,890 12,390 38,280 49 100 58
Natural resources
- Oil and gas 11,145 2,043 13,188 5,401 1,856 7,257 48 91 55
- Mining and metals 2,438 613 3,051 2,058 641 2,699 84 105 88
- Other 13,793 974 14,767 5,227 759 5,986 38 78 41
Transport
- Shipping 6,322 2,731 9,053 4,186 2,745 6,931 66 101 77
- Other 19,794 3,091 22,885 8,310 2,734 11,044 42 88 48
Manufacturing 25,070 8,408 33,478 10,801 8,219 19,020 43 98 57
Retail and leisure 21,388 8,095 29,483 12,786 7,981 20,767 60 99 70
Services 21,919 7,973 29,892 12,901 8,028 20,929 59 101 70
TMT (4) 10,131 2,785 12,916 5,513 2,671 8,184 54 96 63
Total corporates 185,086 49,090 234,176 93,073 48,024 141,097 50 98 60
Personal
Mortgages
- UK 117,153 7,803 124,956 10,123 3,188 13,311 9 41 11
- Ireland 13,992 35 14,027 11,416 16 11,432 82 46 81
- Other Western Europe 198 324 522 16 136 152 8 42 29
- US 132 20,629 20,761 10 10,061 10,071 8 49 49
- RoW 422 724 1,146 37 284 321 9 39 28
Total mortgages 131,897 29,515 161,412 21,602 13,685 35,287 16 46 22
Other personal 30,446 17,239 47,685 12,366 12,801 25,167 41 74 53
Total personal 162,343 46,754 209,097 33,968 26,486 60,454 21 57 29
Other items 4,118 17,885 22,003 2,364 15,543 17,907 57 87 81
Total 497,079 214,658 711,737 167,880 104,570 272,450 34 49 38
For the notes to this table refer to the following page.
*Not within the scope of Deloitte LLP’s review report