RBS 2014 Annual Report Download - page 17
Download and view the complete annual report
Please find page 17 of the 2014 RBS annual report below. You can navigate through the pages in the report by either clicking on the pages listed below, or by using the keyword search tool below to find specific information within the annual report.-
 1
1 -
2
-
3
-
4
-
5
-
6
-
 7
7 -
 8
8 -
 9
9 -
 10
10 -
 11
11 -
 12
12 -
 13
13 -
 14
14 -
 15
15 -
 16
16 -
 17
17 -
 18
18 -
 19
19 -
 20
20 -
 21
21 -
 22
22 -
 23
23 -
 24
24 -
 25
25 -
 26
26 -
 27
27 -
28
-
29
-
30
-
31
-
32
-
33
-
34
-
35
-
36
-
37
-
38
-
39
-
40
-
41
-
42
-
43
-
44
-
45
-
46
-
47
-
48
-
49
-
50
-
51
-
52
-
53
-
54
-
55
-
56
-
57
-
58
-
59
-
60
-
61
-
62
-
63
-
64
-
65
-
66
-
67
-
68
-
69
-
70
-
71
-
72
-
73
-
74
-
75
-
76
-
77
-
78
-
79
-
80
-
81
-
82
-
83
-
84
-
85
-
86
-
87
-
88
-
89
-
90
-
91
-
92
-
93
-
94
-
95
-
96
-
97
-
98
-
99
-
100
-
101
-
102
-
103
-
104
-
105
-
106
-
107
-
108
-
109
-
110
-
111
-
112
-
113
-
114
-
115
-
116
-
117
-
118
-
119
-
120
-
121
-
122
-
123
-
124
-
125
-
126
-
127
-
128
-
129
-
130
-
131
-
132
-
133
-
134
-
135
-
136
-
137
-
138
-
139
-
140
-
141
-
142
-
143
-
144
-
145
-
146
-
147
-
148
-
149
-
150
-
151
-
152
-
153
-
154
-
155
-
156
-
157
-
158
-
159
-
160
-
161
-
162
-
163
-
164
-
165
-
166
-
167
-
168
-
169
-
170
-
171
-
172
-
173
-
174
-
175
-
176
-
177
-
178
-
179
-
180
-
181
-
182
-
183
-
184
-
185
-
186
-
187
-
188
-
189
-
190
-
191
-
192
-
193
-
194
-
195
-
196
-
197
-
198
-
199
 |
 |

15
RBS – Interim Results 2015
Highlights
Q2 2015 performance
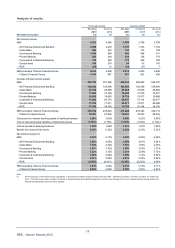
Attributable profit of £293 million was reported in Q2 2015 including £1,050 million of restructuring costs as
the pace of restructuring accelerated and £459 million of litigation and conduct costs. The attributable profit
for Q2 2015 was up from a loss of £446 million in Q1 2015 and a profit of £230 million in Q2 2014.
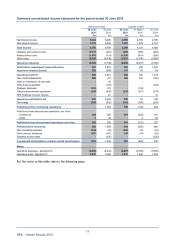
Total income was £4,369 million, with net interest income broadly stable, but non-interest income down 25%
from Q2 2014, reflecting the reduction in the scale of CIB.
Operating expenses totalled £4,206 million, with other costs at £2,697 million, down 3% from Q1 2015 and
12% from Q2 2014. Restructuring costs were significantly higher at £1,050 million, principally relating to CIB
(£734 million) and to Williams & Glyn separation (£126 million). Litigation and conduct costs in Q2 2015
amounted to £459 million, principally related to mortgage-backed securities litigation in the United States.
Credit conditions remained generally benign, with net impairment releases of £141 million, up from £91
million in Q1 2015 and from £93 million in Q2 2014, principally reflecting releases on disposals within RCR.
Operating profit was £304 million, down slightly from £325 million in Q1 2015 and more markedly from
£1,318 million in Q2 2014. Excluding restructuring, litigation and conduct costs, operating profit was £1,813
million, up 11% from Q1 2015 but down 7% from Q2 2014.
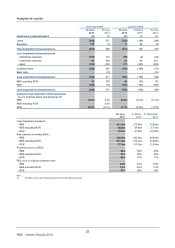
Statutory operating profit before tax, including £168 million of own credit adjustments, was £240 million. After
a tax charge of £100 million, the profit from continuing operations was £140 million, compared with a loss of
£140 million in Q1 2015 and a profit of £458 million in Q2 2014.
Profit from discontinued operations of £674 million reflected the rise in the market value of Citizens shares
during the quarter.
Tangible net asset value per ordinary and equivalent B share was 380p at 30 June 2015 compared with
384p at 31 March 2015, reflecting cash flow hedging and currency translation losses recognised in other
comprehensive income, partly offset by the second quarter attributable profit.