RBS 2014 Annual Report Download - page 57
Download and view the complete annual report
Please find page 57 of the 2014 RBS annual report below. You can navigate through the pages in the report by either clicking on the pages listed below, or by using the keyword search tool below to find specific information within the annual report.-
 1
1 -
2
-
3
-
4
-
5
-
6
-
7
-
8
-
9
-
10
-
11
-
12
-
13
-
14
-
15
-
16
-
17
-
18
-
19
-
20
-
21
-
22
-
23
-
24
-
25
-
26
-
27
-
28
-
29
-
30
-
31
-
32
-
33
-
34
-
35
-
36
-
37
-
38
-
39
-
40
-
41
-
42
-
43
-
44
-
45
-
46
-
 47
47 -
 48
48 -
 49
49 -
 50
50 -
 51
51 -
 52
52 -
 53
53 -
 54
54 -
 55
55 -
 56
56 -
 57
57 -
 58
58 -
 59
59 -
 60
60 -
 61
61 -
 62
62 -
 63
63 -
 64
64 -
 65
65 -
 66
66 -
 67
67 -
68
-
69
-
70
-
71
-
72
-
73
-
74
-
75
-
76
-
77
-
78
-
79
-
80
-
81
-
82
-
83
-
84
-
85
-
86
-
87
-
88
-
89
-
90
-
91
-
92
-
93
-
94
-
95
-
96
-
97
-
98
-
99
-
100
-
101
-
102
-
103
-
104
-
105
-
106
-
107
-
108
-
109
-
110
-
111
-
112
-
113
-
114
-
115
-
116
-
117
-
118
-
119
-
120
-
121
-
122
-
123
-
124
-
125
-
126
-
127
-
128
-
129
-
130
-
131
-
132
-
133
-
134
-
135
-
136
-
137
-
138
-
139
-
140
-
141
-
142
-
143
-
144
-
145
-
146
-
147
-
148
-
149
-
150
-
151
-
152
-
153
-
154
-
155
-
156
-
157
-
158
-
159
-
160
-
161
-
162
-
163
-
164
-
165
-
166
-
167
-
168
-
169
-
170
-
171
-
172
-
173
-
174
-
175
-
176
-
177
-
178
-
179
-
180
-
181
-
182
-
183
-
184
-
185
-
186
-
187
-
188
-
189
-
190
-
191
-
192
-
193
-
194
-
195
-
196
-
197
-
198
-
199
 |
 |
55
RBS – Interim Results 2015
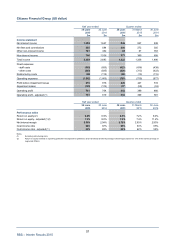
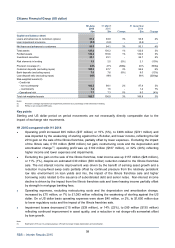
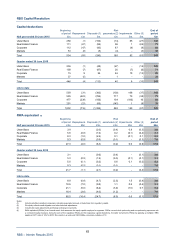
Citizens Financial Group (£ Sterling)
Half year ended Quarter ended
30 June 30 June 30 June 31 March 30 June
2015 2014 2015 2015 2014
£m £m £m £m £m
Income statement
Net interest income 1,104 987 551 553 499
Net fees and commissions 371 350 191 180 181
Other non-interest income 119 270 55 64 210
Non-interest income 490 620 246 244 391
Total income 1,594 1,607 797 797 890
Direct expenses
- staff costs (564) (512) (275) (289) (261)
- other costs (422) (501) (215) (207) (252)
Restructuring costs (33) (69) (27) (6) (69)
Operating expenses (1,019) (1,082) (517) (502) (582)
Profit before impairment losses 575 525 280 295 308
Impairment losses (89) (104) (51) (38) (31)
Operating profit 486 421 229 257 277
Operating profit - adjusted (1) 519 490 256 263 346
A
verage exchange rate - US$/£ 1.524 1.669 1.532 1.514 1.683
Key metrics Half year ended Quarter ended
30 June 30 June 30 June 31 March 30 June
2015 2014 2015 2015 2014
Performance ratios
Return on equity (2) 6.8% 6.9% 6.5% 7.2% 9.0%
Return on equity - adjusted (1,2) 7.3% 8.0% 7.2% 7.4% 11.2%
Net interest margin 2.80% 2.94% 2.78% 2.83% 2.93%
Cost:income ratio 64% 67% 65% 63% 65%
Cost:income ratio - adjusted (1) 62% 63% 62% 62% 58%
Notes:
(1) Excluding restructuring costs.
(2) Return on equity is based on operating profit after tax adjusted for preference share dividends divided by average notional equity (based on 13% of the monthly average o
f
segmental RWAe).