RBS 2014 Annual Report Download - page 43
Download and view the complete annual report
Please find page 43 of the 2014 RBS annual report below. You can navigate through the pages in the report by either clicking on the pages listed below, or by using the keyword search tool below to find specific information within the annual report.-
 1
1 -
2
-
3
-
4
-
5
-
6
-
7
-
8
-
9
-
10
-
11
-
12
-
13
-
14
-
15
-
16
-
17
-
18
-
19
-
20
-
21
-
22
-
23
-
24
-
25
-
26
-
27
-
28
-
29
-
30
-
31
-
32
-
 33
33 -
 34
34 -
 35
35 -
 36
36 -
 37
37 -
 38
38 -
 39
39 -
 40
40 -
 41
41 -
 42
42 -
 43
43 -
 44
44 -
 45
45 -
 46
46 -
 47
47 -
 48
48 -
 49
49 -
 50
50 -
 51
51 -
 52
52 -
 53
53 -
54
-
55
-
56
-
57
-
58
-
59
-
60
-
61
-
62
-
63
-
64
-
65
-
66
-
67
-
68
-
69
-
70
-
71
-
72
-
73
-
74
-
75
-
76
-
77
-
78
-
79
-
80
-
81
-
82
-
83
-
84
-
85
-
86
-
87
-
88
-
89
-
90
-
91
-
92
-
93
-
94
-
95
-
96
-
97
-
98
-
99
-
100
-
101
-
102
-
103
-
104
-
105
-
106
-
107
-
108
-
109
-
110
-
111
-
112
-
113
-
114
-
115
-
116
-
117
-
118
-
119
-
120
-
121
-
122
-
123
-
124
-
125
-
126
-
127
-
128
-
129
-
130
-
131
-
132
-
133
-
134
-
135
-
136
-
137
-
138
-
139
-
140
-
141
-
142
-
143
-
144
-
145
-
146
-
147
-
148
-
149
-
150
-
151
-
152
-
153
-
154
-
155
-
156
-
157
-
158
-
159
-
160
-
161
-
162
-
163
-
164
-
165
-
166
-
167
-
168
-
169
-
170
-
171
-
172
-
173
-
174
-
175
-
176
-
177
-
178
-
179
-
180
-
181
-
182
-
183
-
184
-
185
-
186
-
187
-
188
-
189
-
190
-
191
-
192
-
193
-
194
-
195
-
196
-
197
-
198
-
199
 |
 |
41
RBS – Interim Results 2015
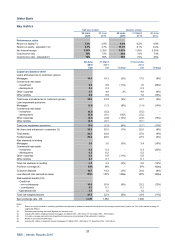
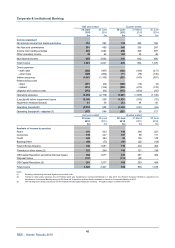
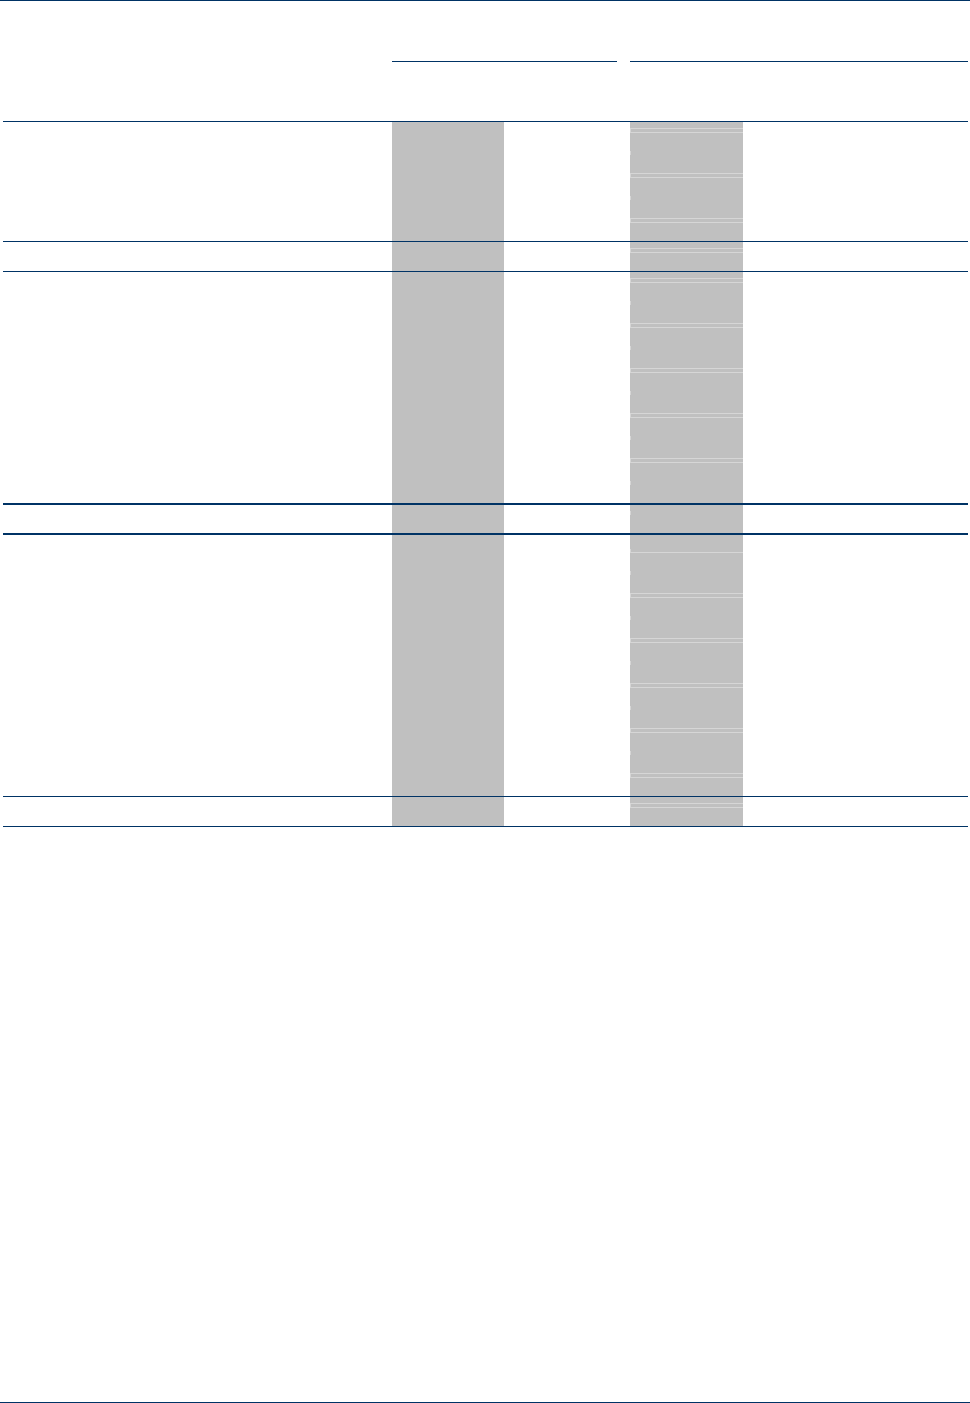
Commercial Banking
Half year ended Quarter ended
30 June 30 June 30 June 31 March 30 June
2015 2014 2015 2015 2014
£m £m £m £m £m
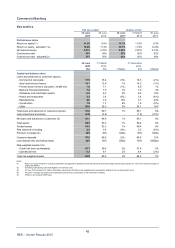
Analysis of income by business
Commercial lending 948 894 499 449 448
Deposits 240 153 124 116 81
A
sset and invoice finance 358 366 180 178 186
Other 168 155 89 79 83
Total income 1,714 1,568 892 822 798
Analysis of impairments by sector
Commercial real estate 8(6) 10 (2) (17)
A
sset and invoice finance 32 2 1 -
Private sector services (education, health, etc) 3(10) - 3 -
Banks & financial institutions 11 1 - (1)
Wholesale and retail trade repairs -14 2 (2) 2
Hotels and restaurants (1) (1) 2 (3) (4)
Manufacturing -7 (1) 1 4
Construction 24 2 - 2
Other 11 20 8 3 5
Total impairment losses/(releases) 27 31 26 1 (9)
Loan impairment charge as % of gross
customer loans and advances by sector
Commercial real estate 0.1% (0.1%) 0.2% - (0.4%)
A
sset and invoice finance -- 0.1% - -
Private sector services (education, health, etc) 0.1% (0.3%) - 0.2% -
Banks & financial institutions -- 0.1% - (0.1%)
Wholesale and retail trade repairs -0.5% 0.1% (0.1%) 0.1%
Hotels and restaurants (0.1%) (0.1%) 0.3% (0.4%) (0.5%)
Manufacturing -0.4% (0.1%) 0.1% 0.4%
Construction 0.2% 0.4% 0.4% - 0.4%
Other 0.1% 0.2% 0.1% - 0.1%
Total 0.1% 0.1% 0.1% - -