RBS 2014 Annual Report Download - page 165
Download and view the complete annual report
Please find page 165 of the 2014 RBS annual report below. You can navigate through the pages in the report by either clicking on the pages listed below, or by using the keyword search tool below to find specific information within the annual report.-
 1
1 -
2
-
3
-
4
-
5
-
6
-
7
-
8
-
9
-
10
-
11
-
12
-
13
-
14
-
15
-
16
-
17
-
18
-
19
-
20
-
21
-
22
-
23
-
24
-
25
-
26
-
27
-
28
-
29
-
30
-
31
-
32
-
33
-
34
-
35
-
36
-
37
-
38
-
39
-
40
-
41
-
42
-
43
-
44
-
45
-
46
-
47
-
48
-
49
-
50
-
51
-
52
-
53
-
54
-
55
-
56
-
57
-
58
-
59
-
60
-
61
-
62
-
63
-
64
-
65
-
66
-
67
-
68
-
69
-
70
-
71
-
72
-
73
-
74
-
75
-
76
-
77
-
78
-
79
-
80
-
81
-
82
-
83
-
84
-
85
-
86
-
87
-
88
-
89
-
90
-
91
-
92
-
93
-
94
-
95
-
96
-
97
-
98
-
99
-
100
-
101
-
102
-
103
-
104
-
105
-
106
-
107
-
108
-
109
-
110
-
111
-
112
-
113
-
114
-
115
-
116
-
117
-
118
-
119
-
120
-
121
-
122
-
123
-
124
-
125
-
126
-
127
-
128
-
129
-
130
-
131
-
132
-
133
-
134
-
135
-
136
-
137
-
138
-
139
-
140
-
141
-
142
-
143
-
144
-
145
-
146
-
147
-
148
-
149
-
150
-
151
-
152
-
153
-
154
-
 155
155 -
 156
156 -
 157
157 -
 158
158 -
 159
159 -
 160
160 -
 161
161 -
 162
162 -
 163
163 -
 164
164 -
 165
165 -
 166
166 -
 167
167 -
 168
168 -
 169
169 -
 170
170 -
 171
171 -
 172
172 -
 173
173 -
 174
174 -
 175
175 -
176
-
177
-
178
-
179
-
180
-
181
-
182
-
183
-
184
-
185
-
186
-
187
-
188
-
189
-
190
-
191
-
192
-
193
-
194
-
195
-
196
-
197
-
198
-
199
 |
 |

30
RBS – Interim Results 2015
Appendix 1 Capital and risk management
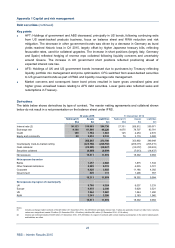
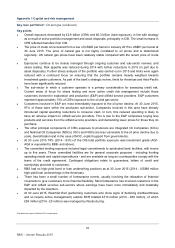
Key loan portfolios*
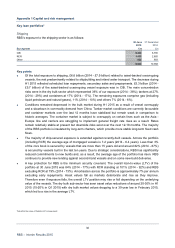
Shipping
RBS’s exposure to the shipping sector is as follows:
30 June 31 Decembe
r
2015 2014
By segment £m £m
CIB 6,338 6,700
RCR 1,463 2,855
Other 828 803
8,629 10,358
Key points
• Of the total exposure to shipping, £6.6 billion (2014 - £7.9 billion) related to asset-backed ocean-going
vessels, the rest predominantly related to shipbuilding and inland water transport. The decrease during
H1 2015 reflected scheduled loan repayments, secondary sales and prepayments. £5.3 billion (2014 -
£5.7 billion) of the asset-backed ocean-going vessel exposure was in CIB. The main concentration
risks were in the dry bulk sector which represented 36% of our exposure (2014 - 38%); tankers at 27%
(2014 - 29%) and containers at 17% (2014 - 17%). The remaining exposures comprise gas (including
liquid petroleum and natural gases), 11% (2014 - 10%) and others 7% (2014 - 6%).
• Conditions remained depressed in the bulk market during H1 2015 as a result of vessel oversuppl
y
and a slowdown in commodity demand from China. Tanker market conditions are currently favourable
and container markets over the last 12 months have stabilised but remain weak in comparison to
historic averages. The container market is subject to oversupply on certain lines such as the Asia -
Europe line and carriers are struggling to implement general freight rate rises as a result. Rates
remain relatively stable at present but downside risks exist over the next 12-18 months. The majority
of the RBS portfolio is insulated by long-term charters, which provide more stable long-term fixed cash
flows.
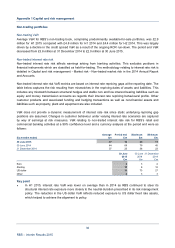
• The majority of ship-secured exposure is extended against recently-built vessels. Across the portfolio
(including RCR) the average age of mortgaged vessels is 7.2 years (2014 - 6.4 years). Less than 3%
of the core book is secured by vessels that are more than 15 years old and around 82% (2014 - 87%)
is secured by vessels built in the last ten years. Due to strategic considerations, RBS has significantly
reduced commitments to new builds and, as a result, the average age of the portfolio has risen. RBS
continues to provide new lending against second-hand vessels and on some new-build deliveries.
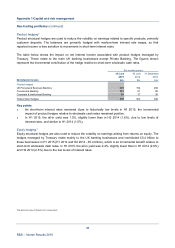
• A key protection for RBS is the minimum security covenant. The overall loan-to-value (LTV) of the
portfolio at 30 June 2015 was 84% (2014 - 77%) with RCR standing at 101% (2014 - 92%) and RBS
excluding RCR at 79% (2014 - 73%). Amortisation across the portfolio is approximately 7% per annum
excluding early repayments. Asset values fall as markets deteriorate and rise as they improve.
Therefore even if exposure falls, the overall LTV position may rise or fall depending on the underlying
value of the vessels. The dry bulk sub-sector has seen asset value reductions of around 20-30% in H1
2015 (15-20% in Q1 2015) with dry bulk market values dropping to a 30-year low in February 2015,
which led to a rise in the average LTV.
*Not within the scope of Deloitte LLP’s review report