RBS 2014 Annual Report Download - page 31
Download and view the complete annual report
Please find page 31 of the 2014 RBS annual report below. You can navigate through the pages in the report by either clicking on the pages listed below, or by using the keyword search tool below to find specific information within the annual report.-
 1
1 -
2
-
3
-
4
-
5
-
6
-
7
-
8
-
9
-
10
-
11
-
12
-
13
-
14
-
15
-
16
-
17
-
18
-
19
-
20
-
 21
21 -
 22
22 -
 23
23 -
 24
24 -
 25
25 -
 26
26 -
 27
27 -
 28
28 -
 29
29 -
 30
30 -
 31
31 -
 32
32 -
 33
33 -
 34
34 -
 35
35 -
 36
36 -
 37
37 -
 38
38 -
 39
39 -
 40
40 -
 41
41 -
42
-
43
-
44
-
45
-
46
-
47
-
48
-
49
-
50
-
51
-
52
-
53
-
54
-
55
-
56
-
57
-
58
-
59
-
60
-
61
-
62
-
63
-
64
-
65
-
66
-
67
-
68
-
69
-
70
-
71
-
72
-
73
-
74
-
75
-
76
-
77
-
78
-
79
-
80
-
81
-
82
-
83
-
84
-
85
-
86
-
87
-
88
-
89
-
90
-
91
-
92
-
93
-
94
-
95
-
96
-
97
-
98
-
99
-
100
-
101
-
102
-
103
-
104
-
105
-
106
-
107
-
108
-
109
-
110
-
111
-
112
-
113
-
114
-
115
-
116
-
117
-
118
-
119
-
120
-
121
-
122
-
123
-
124
-
125
-
126
-
127
-
128
-
129
-
130
-
131
-
132
-
133
-
134
-
135
-
136
-
137
-
138
-
139
-
140
-
141
-
142
-
143
-
144
-
145
-
146
-
147
-
148
-
149
-
150
-
151
-
152
-
153
-
154
-
155
-
156
-
157
-
158
-
159
-
160
-
161
-
162
-
163
-
164
-
165
-
166
-
167
-
168
-
169
-
170
-
171
-
172
-
173
-
174
-
175
-
176
-
177
-
178
-
179
-
180
-
181
-
182
-
183
-
184
-
185
-
186
-
187
-
188
-
189
-
190
-
191
-
192
-
193
-
194
-
195
-
196
-
197
-
198
-
199
 |
 |

29
RBS – Interim Results 2015
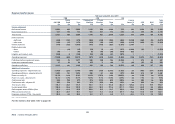
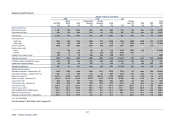
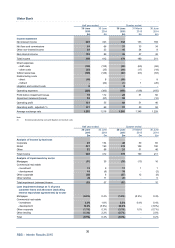
Segment performance
Quarter ended 31 March 2015
PBB CPB CIB
Ulste
r
Commercial Private Central Total
UK PBB Bank Total Banking Banking Total items (1) CFG RCR RBS
£m £m £m £m £m £m £m £m £m £m £m
Income statement
Net interest income 1,143 133 1,276 546 128 674 202 62 553 (11) 2,756
Non-interest income 309 57 366 276 86 362 602 (130) 244 131 1,575
Total income 1,452 190 1,642 822 214 1,036 804 (68) 797 120 4,331
Direct expenses
- staff costs (225) (60) (285) (129) (76) (205) (180) (574) (289) (25) (1,558)
- other costs (71) (17) (88) (54) (12) (66) (78) (785) (207) (6) (1,230)
Indirect expenses (450) (63) (513) (225) (98) (323) (540) 1,393 - (17) -
Restructuring costs
- direct - - - - - - (16) (431) (6) - (453)
- indirect (30) 1 (29) (1) 1 - (275) 304 - - -
Litigation and conduct costs (354) - (354) - (2) (2) (500) - - - (856)
Operating expenses (1,130) (139) (1,269) (409) (187) (596) (1,589) (93) (502) (48) (4,097)
Profit/(loss) before impairment losses 322 51 373 413 27 440 (785) (161) 295 72 234
Impairment releases/(losses) 26 - 26 (1) 1 - 44 (50) (38) 109 91
Operating profit/(loss) 348 51 399 412 28 440 (741) (211) 257 181 325
Additional information
Operating expenses - adjusted (£m) (2) (746) (140) (886) (408) (186) (594) (798) 34 (496) (48) (2,788)
Operating profit/(loss) - adjusted (£m) (2) 732 50 782 413 29 442 50 (84) 263 181 1,634
Return on equity (3) 15.4% 6.2% 12.3% 11.9% 4.4% 10.9% (17.1%) nm 7.2% nm (4.1%)
Return on equity - adjusted (2,3) 34.3% 6.1% 25.2% 11.9% 4.6% 11.0% (0.4%) nm 7.4% nm 5.6%
Cost:income ratio 78% 73% 77% 50% 87% 58% 198% nm 63% nm 95%
Cost:income ratio - adjusted (2) 51% 74% 54% 50% 87% 57% 99% nm 62% nm 64%
Total assets (£bn) 134.6 26.6 161.2 93.3 17.9 111.2 623.8 93.8 91.8 22.8 1,104.6
Funded assets (£bn) 134.6 26.5 161.1 93.3 17.8 111.1 248.4 90.6 91.3 11.1 713.6
Risk-weighted assets (£bn) 42.6 22.4 65.0 65.5 10.2 75.7 102.8 15.9 72.0 17.2 348.6
RWA equivalent (£bn) (4) 46.4 21.5 67.9 71.0 10.2 81.2 105.1 16.2 72.2 21.7 364.3
Employee numbers (FTEs - thousands) 25.1 4.3 29.4 6.2 2.8 9.0 3.5 49.2 17.5 0.6 109.2
nm= not meaningful
For the notes to this table refer to page 30.