RBS 2014 Annual Report Download - page 79
Download and view the complete annual report
Please find page 79 of the 2014 RBS annual report below. You can navigate through the pages in the report by either clicking on the pages listed below, or by using the keyword search tool below to find specific information within the annual report.-
 1
1 -
2
-
3
-
4
-
5
-
6
-
7
-
8
-
9
-
10
-
11
-
12
-
13
-
14
-
15
-
16
-
17
-
18
-
19
-
20
-
21
-
22
-
23
-
24
-
25
-
26
-
27
-
28
-
29
-
30
-
31
-
32
-
33
-
34
-
35
-
36
-
37
-
38
-
39
-
40
-
41
-
42
-
43
-
44
-
45
-
46
-
47
-
48
-
49
-
50
-
51
-
52
-
53
-
54
-
55
-
56
-
57
-
58
-
59
-
60
-
61
-
62
-
63
-
64
-
65
-
66
-
67
-
68
-
 69
69 -
 70
70 -
 71
71 -
 72
72 -
 73
73 -
 74
74 -
 75
75 -
 76
76 -
 77
77 -
 78
78 -
 79
79 -
 80
80 -
 81
81 -
 82
82 -
 83
83 -
 84
84 -
 85
85 -
 86
86 -
 87
87 -
 88
88 -
 89
89 -
90
-
91
-
92
-
93
-
94
-
95
-
96
-
97
-
98
-
99
-
100
-
101
-
102
-
103
-
104
-
105
-
106
-
107
-
108
-
109
-
110
-
111
-
112
-
113
-
114
-
115
-
116
-
117
-
118
-
119
-
120
-
121
-
122
-
123
-
124
-
125
-
126
-
127
-
128
-
129
-
130
-
131
-
132
-
133
-
134
-
135
-
136
-
137
-
138
-
139
-
140
-
141
-
142
-
143
-
144
-
145
-
146
-
147
-
148
-
149
-
150
-
151
-
152
-
153
-
154
-
155
-
156
-
157
-
158
-
159
-
160
-
161
-
162
-
163
-
164
-
165
-
166
-
167
-
168
-
169
-
170
-
171
-
172
-
173
-
174
-
175
-
176
-
177
-
178
-
179
-
180
-
181
-
182
-
183
-
184
-
185
-
186
-
187
-
188
-
189
-
190
-
191
-
192
-
193
-
194
-
195
-
196
-
197
-
198
-
199
 |
 |
77
RBS – Interim Results 2015
Notes
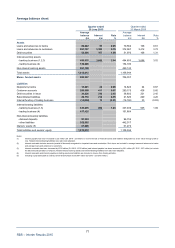
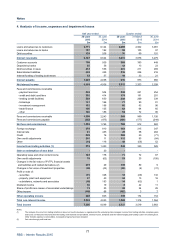
4. Analysis of income, expenses and impairment losses
Half year ended Quarter ended
30 June 30 June 30 June 31 March 30 June
2015 2014 2015 2015 2014
£m £m £m £m £m
Loans and advances to customers 5,771 6,144 2,869 2,902 3,081
Loans and advances to banks 197 192 92 105 97
Debt securities 139 208 70 69 101
Interest receivable 6,107 6,544 3,031 3,076 3,279
Customer accounts 758 939 368 390 449
Deposits by banks 25 58 12 13 23
Debt securities in issue 412 556 201 211 269
Subordinated liabilities 442 428 216 226 218
Internal funding of trading businesses 52 57 19 33 21
Interest payable 1,689 2,038 816 873 980
Net interest income 4,418 4,506 2,215 2,203 2,299
Fees and commissions receivable
- payment services 469 504 238 231 254
- credit and debit card fees 355 414 174 181 201
- lending (credit facilities) 559 650 290 269 339
- brokerage 161 166 71 90 81
- investment management 162 198 80 82 96
- trade finance 126 125 62 64 65
- other 126 186 54 72 90
Fees and commissions receivable 1,958 2,243 969 989 1,126
Fees and commissions payable (363) (475) (186) (177) (244)
Net fees and commissions 1,595 1,768 783 812 882
Foreign exchange 378 810 163 215 347
Interest rate 81 435 23 58 284
Credit 220 76 200 20 (71)
Own credit adjustments 210 11 115 95 (84)
Other (14) 118 44 (58) 52
Income from trading activities (1) 875 1,450 545 330 528
Gain on redemption of own debt -20 - - -
Operating lease and other rental income 143 178 71 72 87
Own credit adjustments 78 (62) 53 25 (106)
Changes in the fair value of FVTPL financial assets
and liabilities and related derivatives (2) 215 29 135 80 9
Changes in fair value of investment properties (30) (43) (26) (4) (31)
Profit on sale of:
- securities (11) 328 18 (29) 132
- property, plant and equipment 47 40 34 13 16
- subsidiaries, networks and associates (48) 193 14 (62) 1
Dividend income 50 19 8 42 11
Share of profits less losses of associated undertakings 73 55 39 34 28
Other income (149) 68 (152) 3 7
Other operating income 368 805 194 174 154
Total non-interest income 2,838 4,043 1,522 1,316 1,564
Total income 7,256 8,549 3,737 3,519 3,863
Notes:
(1) The analysis of income from trading activities is based on how the business is organised and the underlying risks managed. Income from trading activities comprises gains
and losses on financial instruments held for trading, both realised and unrealised, interest income, dividends and the related hedging and funding costs in the trading book.
Other includes equities & commodities. Comparative figures have been restated.
(2) Fair value through profit and loss.