RBS 2014 Annual Report Download - page 52
Download and view the complete annual report
Please find page 52 of the 2014 RBS annual report below. You can navigate through the pages in the report by either clicking on the pages listed below, or by using the keyword search tool below to find specific information within the annual report.-
 1
1 -
2
-
3
-
4
-
5
-
6
-
7
-
8
-
9
-
10
-
11
-
12
-
13
-
14
-
15
-
16
-
17
-
18
-
19
-
20
-
21
-
22
-
23
-
24
-
25
-
26
-
27
-
28
-
29
-
30
-
31
-
32
-
33
-
34
-
35
-
36
-
37
-
38
-
39
-
40
-
41
-
 42
42 -
 43
43 -
 44
44 -
 45
45 -
 46
46 -
 47
47 -
 48
48 -
 49
49 -
 50
50 -
 51
51 -
 52
52 -
 53
53 -
 54
54 -
 55
55 -
 56
56 -
 57
57 -
 58
58 -
 59
59 -
 60
60 -
 61
61 -
 62
62 -
63
-
64
-
65
-
66
-
67
-
68
-
69
-
70
-
71
-
72
-
73
-
74
-
75
-
76
-
77
-
78
-
79
-
80
-
81
-
82
-
83
-
84
-
85
-
86
-
87
-
88
-
89
-
90
-
91
-
92
-
93
-
94
-
95
-
96
-
97
-
98
-
99
-
100
-
101
-
102
-
103
-
104
-
105
-
106
-
107
-
108
-
109
-
110
-
111
-
112
-
113
-
114
-
115
-
116
-
117
-
118
-
119
-
120
-
121
-
122
-
123
-
124
-
125
-
126
-
127
-
128
-
129
-
130
-
131
-
132
-
133
-
134
-
135
-
136
-
137
-
138
-
139
-
140
-
141
-
142
-
143
-
144
-
145
-
146
-
147
-
148
-
149
-
150
-
151
-
152
-
153
-
154
-
155
-
156
-
157
-
158
-
159
-
160
-
161
-
162
-
163
-
164
-
165
-
166
-
167
-
168
-
169
-
170
-
171
-
172
-
173
-
174
-
175
-
176
-
177
-
178
-
179
-
180
-
181
-
182
-
183
-
184
-
185
-
186
-
187
-
188
-
189
-
190
-
191
-
192
-
193
-
194
-
195
-
196
-
197
-
198
-
199
 |
 |

50
RBS – Interim Results 2015
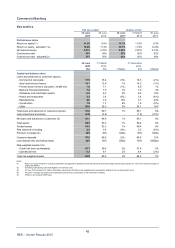
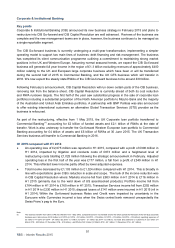
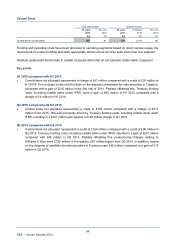
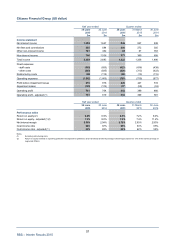
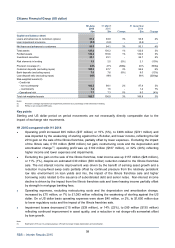
Corporate & Institutional Banking
Half year ended Quarter ended
30 June 30 June 30 June 31 March 30 June
Key metrics
2015 2014 2015 2015 2014
Performance ratios
Return on equity (1) (24.6%) 1.6% (33.0%) (17.1%) (1.5%)
Return on equity - adjusted (1,2) (3.5%) 3.5% (6.9%) (0.4%) 1.9%
Net interest margin 1.06% 0.88% 1.00% 1.12% 0.90%
Cost:income ratio 259% 89% 354% 198% 107%
Cost:income ratio - adjusted (2) 116% 79% 141% 99% 88%
30 June 31 March 31 Decembe
r
2015 2015 2014
£bn £bn Change £bn Change
Capital and balance sheet
Loans and advances to customers (gross, excluding
reverse repos) 57.9 76.8 (25%) 73.0 (21%)
Loan impairment provisions (0.1) (0.1) - (0.2) (50%)
Total loans and advances to customers (excluding
reverse repos) 57.8 76.7 (25%) 72.8 (21%)
Loans and advances to banks (excluding reverse
repos) (3) 13.6 18.5 (26%) 16.9 (20%)
Reverse repos 63.0 68.4 (8%) 61.6 2%
Securities 40.8 48.2 (15%) 57.0 (28%)
Cash and eligible bills 22.4 20.8 8% 23.2 (3%)
Other 13.5 15.8 (15%) 9.6 41%
Total assets 482.4 623.8 (23%) 577.2 (16%)
Funded assets 211.1 248.4 (15%) 241.1 (12%)
Provision coverage (4) 65% 82% (1,700bp) 105% (4,000bp)
Customer deposits (excluding repos) 49.2 58.4 (16%) 59.4 (17%)
Bank deposits (excluding repos) 28.7 34.7 (17%) 33.3 (14%)
Repos 61.0 68.3 (11%) 61.1 -
Debt securities in issue 10.5 12.4 (15%) 14.1 (26%)
Loan:deposit ratio (excluding repos) 117% 131% (1,400bp) 122% (500bp)
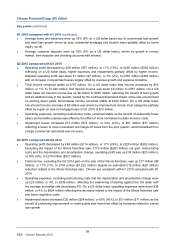
Risk-weighted assets (5)
- Credit risk
- non-counterparty 38.6 49.8 (22%) 51.3 (25%)
- counterparty 22.9 26.1 (12%) 25.1 (9%)
- Market risk 18.1 18.4 (2%) 18.9 (4%)
- Operational risk 8.4 8.5 (1%) 11.8 (29%)
Total risk-weighted assets 88.0 102.8 (14%) 107.1 (18%)
Of which: CIB Capital Resolution (6)
Funded assets 62.3 85.8 (27%) 95.0 (34%)
Risk-weighted assets 45.2 57.8 (22%) 63.8 (29%)
Notes:
(1) Return on equity is based on operating profit after tax adjusted for preference share dividends divided by average notional equity (based on 13% of the monthly average o
f
segmental RWAe).
(2) Excluding restructuring costs and litigation and conduct costs.
(3) Excludes disposal groups.
(4) Provision coverage represents loan impairment provisions as a percentage of risk elements in lending.
(5) RWAs on an end-point CRR basis. £88 billion includes £9 billion of RWAs related to businesses that will transfer out of CIB, comprising the Western European Large
Corporate portfolio (expected to move to Commercial Banking in H2 2015) and UK Transaction Services (to Commercial Banking in 2016).
(6) The CIB segment is being restructured into CIB Go-forward and CIB Capital Resolution elements. The split is subject to further refinement.