RBS 2014 Annual Report Download - page 178
Download and view the complete annual report
Please find page 178 of the 2014 RBS annual report below. You can navigate through the pages in the report by either clicking on the pages listed below, or by using the keyword search tool below to find specific information within the annual report.-
 1
1 -
2
-
3
-
4
-
5
-
6
-
7
-
8
-
9
-
10
-
11
-
12
-
13
-
14
-
15
-
16
-
17
-
18
-
19
-
20
-
21
-
22
-
23
-
24
-
25
-
26
-
27
-
28
-
29
-
30
-
31
-
32
-
33
-
34
-
35
-
36
-
37
-
38
-
39
-
40
-
41
-
42
-
43
-
44
-
45
-
46
-
47
-
48
-
49
-
50
-
51
-
52
-
53
-
54
-
55
-
56
-
57
-
58
-
59
-
60
-
61
-
62
-
63
-
64
-
65
-
66
-
67
-
68
-
69
-
70
-
71
-
72
-
73
-
74
-
75
-
76
-
77
-
78
-
79
-
80
-
81
-
82
-
83
-
84
-
85
-
86
-
87
-
88
-
89
-
90
-
91
-
92
-
93
-
94
-
95
-
96
-
97
-
98
-
99
-
100
-
101
-
102
-
103
-
104
-
105
-
106
-
107
-
108
-
109
-
110
-
111
-
112
-
113
-
114
-
115
-
116
-
117
-
118
-
119
-
120
-
121
-
122
-
123
-
124
-
125
-
126
-
127
-
128
-
129
-
130
-
131
-
132
-
133
-
134
-
135
-
136
-
137
-
138
-
139
-
140
-
141
-
142
-
143
-
144
-
145
-
146
-
147
-
148
-
149
-
150
-
151
-
152
-
153
-
154
-
155
-
156
-
157
-
158
-
159
-
160
-
161
-
162
-
163
-
164
-
165
-
166
-
167
-
 168
168 -
 169
169 -
 170
170 -
 171
171 -
 172
172 -
 173
173 -
 174
174 -
 175
175 -
 176
176 -
 177
177 -
 178
178 -
 179
179 -
 180
180 -
 181
181 -
 182
182 -
 183
183 -
 184
184 -
 185
185 -
 186
186 -
 187
187 -
 188
188 -
189
-
190
-
191
-
192
-
193
-
194
-
195
-
196
-
197
-
198
-
199
 |
 |

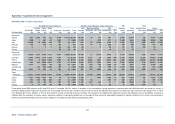
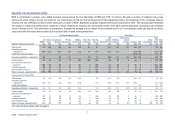
43
RBS – Interim Results 2015
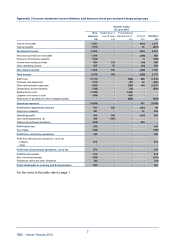
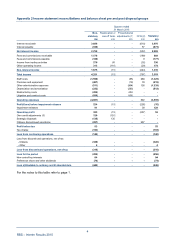
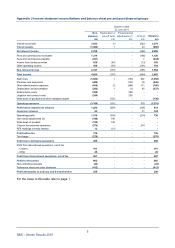
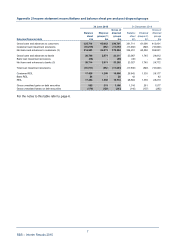
Appendix 1 Capital and risk management
Country exposures (continued)
Net balance sheet exposure Analysis of net balance sheet exposures Off- CDS
Central Othe
r
Othe
r
Net Debt securities Net balance Total notional Gross
Sovereign banks banks FI Corporate Personal Total lending AFS/LAR HFT (net) Derivatives SFT sheet exposure less fair value Derivatives SFT
31 December 2014 £m £m £m £m £m £m £m £m £m £m £m £m £m £m £m £m £m
Eurozone
Ireland 239 587 726 839 5,653 14,593 22,637 21,176 56 413 991 12,922 25,559 (48) 2,330 1,464
Spain 251 - 583 164 2,184 88 3,270 2,024 47 364 835 -1,923 5,193 (312) 3,913 422
Italy 112 15 2,519 368 1,187 25 4,226 1,095 169 5 2,957 -2,031 6,257 (625) 9,192 823
Portugal 111 - 246 97 322 8 784 282 20 152 330 -222 1,006 (155) 390 613
Greece 8 - 258 192 17 376 63 - 8 305 -23 399 (8) 416 -
Cyprus - - - -113 14 127 108 - - 19 -16 143 - 19 -
Eurozone
periphery 721 602 4,332 1,469 9,551 14,745 31,420 24,748 292 942 5,437 17,137 38,557 (1,148) 16,260 3,322
Germany 12,301 2,681 3,940 5,496 2,083 86 26,587 4,601 7,121 5,653 8,317 895 6,090 32,677 (1,749) 39,275 8,704
France 5,203 3 7,089 1,924 1,774 81 16,074 2,931 1,951 4,034 6,392 766 8,586 24,660 (2,406) 41,132 17,598
Netherlands 72 926 5,557 5,981 2,130 29 14,695 3,582 1,690 2,509 6,830 84 9,323 24,018 (815) 20,986 3,573
Belgium 803 3 2,330 93 396 21 3,646 579 274 375 2,334 84 858 4,504 (219) 3,374 932
Luxembourg (1) 19 556 645 781 5 2,005 968 329 70 461 177 1,475 3,480 (53) 701 2,628
Other 1,689 19 762 132 533 16 3,151 612 456 930 1,148 51,047 4,198 (562) 4,818 302
Total
eurozone 20,788 4,253 24,566 15,740 17,248 14,983 97,578 38,021 12,113 14,513 30,919 2,012 34,516 132,094 (6,952) 126,546 37,059
Japan 3,257 1,007 1,927 514 325 33 7,063 1,633 3 3,043 2,358 26 844 7,907 (25) 10,129 10,005
China 329 130 1,011 363 1,674 41 3,548 2,886 243 62 243 114 531 4,079 (4) 244 4,770
India 526 85 133 156 1,053 36 1,989 1,336 415 132 106 -639 2,628 (47) 180 -
Russia 39 14 711 101 915 50 1,830 1,673 39 - 118 -167 1,997 (166) 202 -