RBS 2014 Annual Report Download - page 67
Download and view the complete annual report
Please find page 67 of the 2014 RBS annual report below. You can navigate through the pages in the report by either clicking on the pages listed below, or by using the keyword search tool below to find specific information within the annual report.-
 1
1 -
2
-
3
-
4
-
5
-
6
-
7
-
8
-
9
-
10
-
11
-
12
-
13
-
14
-
15
-
16
-
17
-
18
-
19
-
20
-
21
-
22
-
23
-
24
-
25
-
26
-
27
-
28
-
29
-
30
-
31
-
32
-
33
-
34
-
35
-
36
-
37
-
38
-
39
-
40
-
41
-
42
-
43
-
44
-
45
-
46
-
47
-
48
-
49
-
50
-
51
-
52
-
53
-
54
-
55
-
56
-
 57
57 -
 58
58 -
 59
59 -
 60
60 -
 61
61 -
 62
62 -
 63
63 -
 64
64 -
 65
65 -
 66
66 -
 67
67 -
 68
68 -
 69
69 -
 70
70 -
 71
71 -
 72
72 -
 73
73 -
 74
74 -
 75
75 -
 76
76 -
 77
77 -
78
-
79
-
80
-
81
-
82
-
83
-
84
-
85
-
86
-
87
-
88
-
89
-
90
-
91
-
92
-
93
-
94
-
95
-
96
-
97
-
98
-
99
-
100
-
101
-
102
-
103
-
104
-
105
-
106
-
107
-
108
-
109
-
110
-
111
-
112
-
113
-
114
-
115
-
116
-
117
-
118
-
119
-
120
-
121
-
122
-
123
-
124
-
125
-
126
-
127
-
128
-
129
-
130
-
131
-
132
-
133
-
134
-
135
-
136
-
137
-
138
-
139
-
140
-
141
-
142
-
143
-
144
-
145
-
146
-
147
-
148
-
149
-
150
-
151
-
152
-
153
-
154
-
155
-
156
-
157
-
158
-
159
-
160
-
161
-
162
-
163
-
164
-
165
-
166
-
167
-
168
-
169
-
170
-
171
-
172
-
173
-
174
-
175
-
176
-
177
-
178
-
179
-
180
-
181
-
182
-
183
-
184
-
185
-
186
-
187
-
188
-
189
-
190
-
191
-
192
-
193
-
194
-
195
-
196
-
197
-
198
-
199
 |
 |

65
RBS – Interim Results 2015
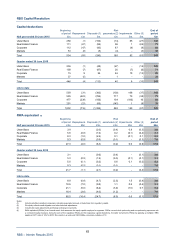
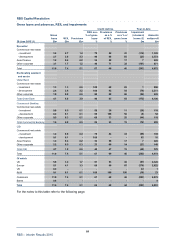
RBS Capital Resolution
Credit metrics Year-to-date
REIL as a Provisions Provisions Impairment
Gross % of gross as a % as a % o
f
(releases)/ Amounts
loans REIL Provisions loans of REIL gross loans losses (2) written-of
f
31 December 2014 (1) £bn £bn £bn % % % £m £m
By sector:
Commercial real estate
- investment 6.2 4.9 2.8 79 57 45 (553) 1,911
- development 6.4 6.2 5.3 97 85 83 (611) 560
A
sset finance 2.3 0.9 0.4 39 44 17 37 80
Other corporate 7.0 3.4 2.4 49 71 34 (169) 1,032
21.9 15.4 10.9 70 71 50 (1,296) 3,583
By donating segment
and sector
Ulster Bank
Commercial real estate
- investment 3.0 2.9 2.0 97 69 67 (450) 445
- development 5.8 5.8 5.1 100 88 88 (608) 425
Other corporate 2.2 2.0 1.5 91 75 68 (48) 256
Total Ulster Bank 11.0 10.7 8.6 97 80 78 (1,106) 1,126
Commercial Banking
Commercial real estate
- investment 1.2 0.7 0.2 58 29 17 (5) 228
- development 0.4 0.3 0.1 75 33 25 (11) 104
Other corporate 1.0 0.5 0.3 50 60 30 - 192
Total Commercial Banking 2.6 1.5 0.6 58 40 23 (16) 524
CIB
Commercial real estate
- investment 2.0 1.3 0.6 65 46 30 (98) 1,238
- development 0.2 0.1 0.1 50 100 50 8 31
A
sset finance 2.3 0.9 0.4 39 44 17 37 80
Other corporate 3.8 0.9 0.6 24 67 16 (121) 584
Total CIB 8.3 3.2 1.7 39 53 20 (174) 1,933
Total 21.9 15.4 10.9 70 71 50 (1,296) 3,583
Of which:
UK 10.0 6.2 4.1 62 66 41 (402) 2,266
Europe 10.9 8.9 6.6 82 74 61 (875) 1,267
US 0.3 0.1 -33 -- (19) 26
RoW 0.7 0.2 0.2 29 100 29 - 24
Customers 21.9 15.4 10.9 70 71 50 (1,296) 3,583
Banks 0.5 - -- -- (10) 8
Total 22.4 15.4 10.9 69 71 49 (1,306) 3,591
Notes:
(1) Includes disposal groups.
(2) Impairment (releases)/losses include those relating to AFS securities; sector analyses above include allocation of latent impairment charges.