RBS 2014 Annual Report Download - page 14
Download and view the complete annual report
Please find page 14 of the 2014 RBS annual report below. You can navigate through the pages in the report by either clicking on the pages listed below, or by using the keyword search tool below to find specific information within the annual report.-
 1
1 -
2
-
3
-
 4
4 -
 5
5 -
 6
6 -
 7
7 -
 8
8 -
 9
9 -
 10
10 -
 11
11 -
 12
12 -
 13
13 -
 14
14 -
 15
15 -
 16
16 -
 17
17 -
 18
18 -
 19
19 -
 20
20 -
 21
21 -
 22
22 -
 23
23 -
 24
24 -
25
-
26
-
27
-
28
-
29
-
30
-
31
-
32
-
33
-
34
-
35
-
36
-
37
-
38
-
39
-
40
-
41
-
42
-
43
-
44
-
45
-
46
-
47
-
48
-
49
-
50
-
51
-
52
-
53
-
54
-
55
-
56
-
57
-
58
-
59
-
60
-
61
-
62
-
63
-
64
-
65
-
66
-
67
-
68
-
69
-
70
-
71
-
72
-
73
-
74
-
75
-
76
-
77
-
78
-
79
-
80
-
81
-
82
-
83
-
84
-
85
-
86
-
87
-
88
-
89
-
90
-
91
-
92
-
93
-
94
-
95
-
96
-
97
-
98
-
99
-
100
-
101
-
102
-
103
-
104
-
105
-
106
-
107
-
108
-
109
-
110
-
111
-
112
-
113
-
114
-
115
-
116
-
117
-
118
-
119
-
120
-
121
-
122
-
123
-
124
-
125
-
126
-
127
-
128
-
129
-
130
-
131
-
132
-
133
-
134
-
135
-
136
-
137
-
138
-
139
-
140
-
141
-
142
-
143
-
144
-
145
-
146
-
147
-
148
-
149
-
150
-
151
-
152
-
153
-
154
-
155
-
156
-
157
-
158
-
159
-
160
-
161
-
162
-
163
-
164
-
165
-
166
-
167
-
168
-
169
-
170
-
171
-
172
-
173
-
174
-
175
-
176
-
177
-
178
-
179
-
180
-
181
-
182
-
183
-
184
-
185
-
186
-
187
-
188
-
189
-
190
-
191
-
192
-
193
-
194
-
195
-
196
-
197
-
198
-
199
 |
 |

12
RBS – Interim Results 2015
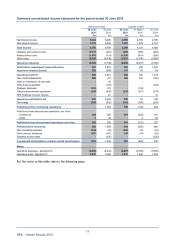
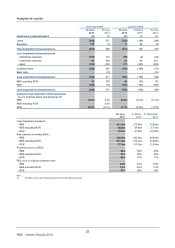
Summary consolidated income statement for the period ended 30 June 2015
Half year ended Quarter ended
30 June 30 June 30 June 31 March 30 June
Key metrics and ratios 2015 2014 2015 2015 2014
Net interest margin 2.24% 2.17% 2.23% 2.26% 2.22%
Cost:income ratio 95% 71% 96% 95% 75%
(Loss)/earnings per share from continuing operations (4)
- basic (1.9p) 9.9p 0.2p (2.1p) 0.3p
- adjusted (5) (2.7p) 9.5p (0.9p) (1.7p) 2.7p
Return on tangible equity (6) (0.7%) 6.9% 2.7% (4.1%) 2.2%
A
verage tangible equity (6) £43,524m £41,579m £43,062m £43,879m £42,122m
A
verage number of ordinary shares and equivalent B
shares outstanding during the period (millions) 11,481 11,308 11,511 11,451 11,335
Key metrics and ratios - excluding Citizens (7)
Net interest margin 2.14% 2.06% 2.13% 2.15% 2.11%
Cost:income ratio 103% 72% 103% 102% 77%
Notes:
(1) Operating profit before tax, own credit adjustments, gain on redemption of own debt, write down of goodwill and strategic disposals and includes the results of Citizens
(prior to any fair value adjustment) which are classified as discontinued operations in the statutory results. The half year and quarter ended 30 June 2014 are stated before
RFS minority interest.
(2) Included within Citizens discontinued operations are the results of the reportable operating segment Citizens Financial Group (CFG), the fair value remeasurement of the
loss on transfer to disposal groups, and certain Citizens related activities in Central items and related one-off and other items.
(3) Excluding restructuring costs and litigation and conduct costs.
(4) Refer to Note 11 on page 84 for further details.
(5) Adjusted earnings excludes own credit adjustments, gain on redemption of own debt, write down of goodwill, strategic disposals and RFS MI.
(6) Tangible equity is equity attributable to ordinary and B shareholders less intangible assets.
(7) Assuming Citizens was fully divested of at its carrying value on 30 June 2015.
Details of other comprehensive income are provided on page 68.