RBS 2014 Annual Report Download - page 147
Download and view the complete annual report
Please find page 147 of the 2014 RBS annual report below. You can navigate through the pages in the report by either clicking on the pages listed below, or by using the keyword search tool below to find specific information within the annual report.-
 1
1 -
2
-
3
-
4
-
5
-
6
-
7
-
8
-
9
-
10
-
11
-
12
-
13
-
14
-
15
-
16
-
17
-
18
-
19
-
20
-
21
-
22
-
23
-
24
-
25
-
26
-
27
-
28
-
29
-
30
-
31
-
32
-
33
-
34
-
35
-
36
-
37
-
38
-
39
-
40
-
41
-
42
-
43
-
44
-
45
-
46
-
47
-
48
-
49
-
50
-
51
-
52
-
53
-
54
-
55
-
56
-
57
-
58
-
59
-
60
-
61
-
62
-
63
-
64
-
65
-
66
-
67
-
68
-
69
-
70
-
71
-
72
-
73
-
74
-
75
-
76
-
77
-
78
-
79
-
80
-
81
-
82
-
83
-
84
-
85
-
86
-
87
-
88
-
89
-
90
-
91
-
92
-
93
-
94
-
95
-
96
-
97
-
98
-
99
-
100
-
101
-
102
-
103
-
104
-
105
-
106
-
107
-
108
-
109
-
110
-
111
-
112
-
113
-
114
-
115
-
116
-
117
-
118
-
119
-
120
-
121
-
122
-
123
-
124
-
125
-
126
-
127
-
128
-
129
-
130
-
131
-
132
-
133
-
134
-
135
-
136
-
 137
137 -
 138
138 -
 139
139 -
 140
140 -
 141
141 -
 142
142 -
 143
143 -
 144
144 -
 145
145 -
 146
146 -
 147
147 -
 148
148 -
 149
149 -
 150
150 -
 151
151 -
 152
152 -
 153
153 -
 154
154 -
 155
155 -
 156
156 -
 157
157 -
158
-
159
-
160
-
161
-
162
-
163
-
164
-
165
-
166
-
167
-
168
-
169
-
170
-
171
-
172
-
173
-
174
-
175
-
176
-
177
-
178
-
179
-
180
-
181
-
182
-
183
-
184
-
185
-
186
-
187
-
188
-
189
-
190
-
191
-
192
-
193
-
194
-
195
-
196
-
197
-
198
-
199
 |
 |

12
RBS – Interim Results 2015
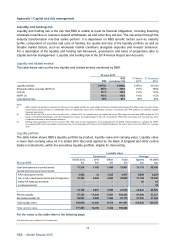
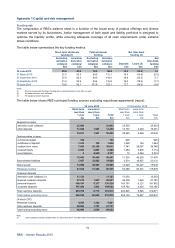
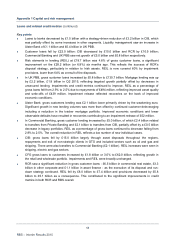
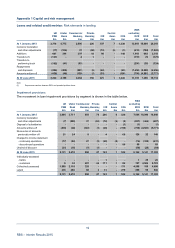
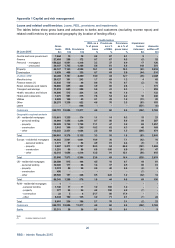
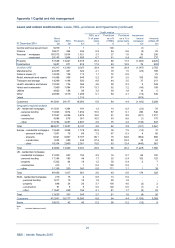
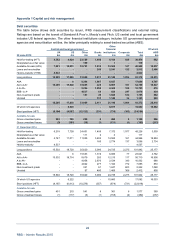
Appendix 1 Capital and risk management
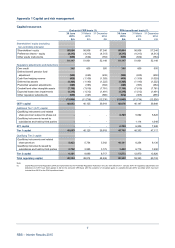
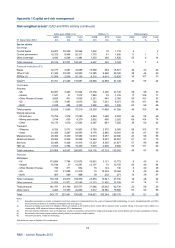
Risk-weighted assets*: EAD and RWA density (continued)
EAD post CRM (1,2) RWAs (1) RWA density
AIRB STD Total AIRB STD Total AIRB STD Total
31 December 2014 £m £m £m £m £m £m % % %
Sector cluster
Sovereign
Central banks 44,007 50,539 94,546 1,632 78 1,710 4 -2
Central government 16,373 9,944 26,317 1,775 61 1,836 11 17
Other sovereign 4,936 6,548 11,484 1,250 386 1,636 25 614
Total sovereign 65,316 67,031 132,347 4,657 525 5,182 7 14
Financial institutions (FI)
Banks 32,777 2,081 34,858 15,089 488 15,577 46 23 45
Other FI (2) 41,420 22,535 63,955 15,585 9,960 25,545 38 44 40
SSPEs (3) 17,504 2,634 20,138 6,216 4,410 10,626 36 167 53
Total FI 91,701 27,250 118,951 36,890 14,858 51,748 40 55 44
Corporates
Property
- UK 48,081 3,463 51,544 23,736 3,390 27,126 49 98 53
- Ireland 7,541 31 7,572 1,283 33 1,316 17 106 17
- Other Western Europe 4,625 431 5,056 2,321 445 2,766 50 103 55
- US 1,334 7,481 8,815 722 7,551 8,273 54 101 94
- RoW 2,048 284 2,332 1,296 249 1,545 63 88 66
Total property 63,629 11,690 75,319 29,358 11,668 41,026 46 100 54
Natural resources
- Oil and gas 15,704 1,876 17,580 6,864 1,665 8,529 44 89 49
- Mining and metals 3,744 635 4,379 2,602 660 3,262 69 104 74
- Other 16,173 1,070 17,243 6,367 861 7,228 39 80 42
Transport
- Shipping 8,332 2,571 10,903 5,790 2,575 8,365 69 100 77
- Other 21,268 3,297 24,565 9,176 2,865 12,041 43 87 49
Manufacturing 29,450 8,430 37,880 12,673 8,257 20,930 43 98 55
Retail and leisure 24,564 8,262 32,826 14,940 8,027 22,967 61 97 70
Services 23,489 8,426 31,915 13,327 8,350 21,677 57 99 68
TMT (4) 13,555 2,790 16,345 7,079 2,806 9,885 52 101 60
Total corporates 219,908 49,047 268,955 108,176 47,734 155,910 49 97 58
Personal
Mortgages
- UK 113,884 7,794 121,678 10,651 3,121 13,772 9 40 11
- Ireland 15,544 37 15,581 13,137 18 13,155 85 49 84
- Other Western Europe 193 311 504 16 124 140 8 40 28
- US 131 21,088 21,219 10 10,352 10,362 8 49 49
- RoW 407 589 996 39 232 271 10 39 27
Total mortgages 130,159 29,819 159,978 23,853 13,847 37,700 18 46 24
Other personal 31,628 15,971 47,599 13,233 11,805 25,038 42 74 53
Total personal 161,787 45,790 207,577 37,086 25,652 62,738 23 56 30
Other items 4,465 18,363 22,828 3,012 16,580 19,592 67 90 86
Total 543,177 207,481 750,658 189,821 105,349 295,170 35 51 39
Notes:
(1) Regulatory permissions to model counterparty credit risk exposure is independent from the scope of applying AIRB methodology. As such, standardised EAD and RW
A
will incorporate an element of modelled counterparty credit risk exposure.
(2) Exposure at default post credit risk mitigation reflects an estimate of the extent to which a bank will be exposed under a specific facility, in the event of the default of a
counterparty; AIRB: advanced internal ratings based; STD: standardised.
(3) Non-bank financial institutions, such as US agencies, insurance companies, pension funds, hedge and leverage funds, broker-dealers and non-bank subsidiaries of banks.
(4) Securitisation structured purpose entities primarily relate to securitisation related vehicles.
(5) Telecommunications, media and technology.
*Not within the scope of Deloitte LLP’s review report