RBS 2014 Annual Report Download - page 143
Download and view the complete annual report
Please find page 143 of the 2014 RBS annual report below. You can navigate through the pages in the report by either clicking on the pages listed below, or by using the keyword search tool below to find specific information within the annual report.-
 1
1 -
2
-
3
-
4
-
5
-
6
-
7
-
8
-
9
-
10
-
11
-
12
-
13
-
14
-
15
-
16
-
17
-
18
-
19
-
20
-
21
-
22
-
23
-
24
-
25
-
26
-
27
-
28
-
29
-
30
-
31
-
32
-
33
-
34
-
35
-
36
-
37
-
38
-
39
-
40
-
41
-
42
-
43
-
44
-
45
-
46
-
47
-
48
-
49
-
50
-
51
-
52
-
53
-
54
-
55
-
56
-
57
-
58
-
59
-
60
-
61
-
62
-
63
-
64
-
65
-
66
-
67
-
68
-
69
-
70
-
71
-
72
-
73
-
74
-
75
-
76
-
77
-
78
-
79
-
80
-
81
-
82
-
83
-
84
-
85
-
86
-
87
-
88
-
89
-
90
-
91
-
92
-
93
-
94
-
95
-
96
-
97
-
98
-
99
-
100
-
101
-
102
-
103
-
104
-
105
-
106
-
107
-
108
-
109
-
110
-
111
-
112
-
113
-
114
-
115
-
116
-
117
-
118
-
119
-
120
-
121
-
122
-
123
-
124
-
125
-
126
-
127
-
128
-
129
-
130
-
131
-
132
-
 133
133 -
 134
134 -
 135
135 -
 136
136 -
 137
137 -
 138
138 -
 139
139 -
 140
140 -
 141
141 -
 142
142 -
 143
143 -
 144
144 -
 145
145 -
 146
146 -
 147
147 -
 148
148 -
 149
149 -
 150
150 -
 151
151 -
 152
152 -
 153
153 -
154
-
155
-
156
-
157
-
158
-
159
-
160
-
161
-
162
-
163
-
164
-
165
-
166
-
167
-
168
-
169
-
170
-
171
-
172
-
173
-
174
-
175
-
176
-
177
-
178
-
179
-
180
-
181
-
182
-
183
-
184
-
185
-
186
-
187
-
188
-
189
-
190
-
191
-
192
-
193
-
194
-
195
-
196
-
197
-
198
-
199
 |
 |

8
RBS – Interim Results 2015
Appendix 1 Capital and risk management
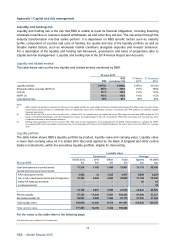
Capital resources (continued)
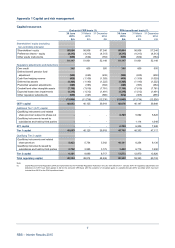
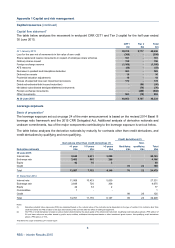
Capital flow statement*
The table below analyses the movement in end-point CRR CET1 and Tier 2 capital for the half year ended
30 June 2015.
CET1 Tier 2 Total
£m £m £m
A
t 1 January 2015 39,919 8,717 48,636
Loss for the year net of movements in fair value of own credit (308) - (308)
Share capital and reserve movements in respect of employee share schemes 161 - 161
Ordinary shares issued 150 - 150
Foreign exchange reserve (1,166) - (1,166)
A
FS reserves (55) - (55)
Decrease in goodwill and intangibles deduction 583 - 583
Deferred tax assets 16 - 16
Prudential valuation adjustments 18 - 18
Excess of expected loss over impairment provisions 172 - 172
Dated subordinated debt issues/(maturities) - (50) (50)
Net dated subordinated debt/grandfathered instruments - (76) (76)
Foreign exchange movements - (400) (400)
Other movements 563 (10) 553
At 30 June 2015 40,053 8,181 48,234
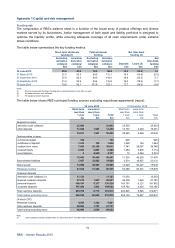
Leverage exposure
Basis of preparation*
The leverage exposure set out on page 24 of the main announcement is based on the revised 2014 Basel III
leverage ratio framework and the 2015 CRR Delegated Act. Additional analysis of derivative notionals and
undrawn commitments, two of the major components contributing to the leverage exposure is set out below.
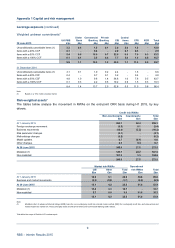
The table below analyses the derivative notionals by maturity for contracts other than credit derivatives, and
credit derivatives by qualifying and non-qualifying.
Credit derivatives (2)
Derivatives other than credit derivatives (1) Non-
<1 yea
r
1-5 years >5 years Qualifying qualifying Total
Derivative notionals £bn £bn £bn £bn £bn £bn
30 June 2015
Interest rate 9,642 6,631 3,850 20,123
Exchange rate 3,403 505 288 4,196
Equity 42 16 2 60
Credit 78 22 100
Total 13,087 7,152 4,140 78 22 24,479
31 December 2014
Interest rate 11,069 10,423 5,839 27,331
Exchange rate 3,649 720 306 4,675
Equity 42 33 2 77
Commodities 1 -- 1
Credit 99 26 125
Total 14,761 11,176 6,147 99 26 32,209
Notes:
(1) Derivative potential future exposures (PFE) are calculated based on the notional value of the contracts and is dependent on the type of contract. For contracts other than
credit derivatives the PFE is based on the type and maturity of the contract after the effect of netting arrangements.
(2) The PFE on credit derivatives is based on add-on factors determined by the asset quality of the referenced instrument. Qualifying credit derivatives attract a PFE add-on o
f
5% and have reference securities issued by public sector entities, multilateral development banks or other investment grade issuers. Non-qualifying credit derivatives
attract a PFE add-on of 10%.
*Not within the scope of Deloitte LLP’s review report