RBS 2014 Annual Report Download - page 15
Download and view the complete annual report
Please find page 15 of the 2014 RBS annual report below. You can navigate through the pages in the report by either clicking on the pages listed below, or by using the keyword search tool below to find specific information within the annual report.-
 1
1 -
2
-
3
-
4
-
 5
5 -
 6
6 -
 7
7 -
 8
8 -
 9
9 -
 10
10 -
 11
11 -
 12
12 -
 13
13 -
 14
14 -
 15
15 -
 16
16 -
 17
17 -
 18
18 -
 19
19 -
 20
20 -
 21
21 -
 22
22 -
 23
23 -
 24
24 -
 25
25 -
26
-
27
-
28
-
29
-
30
-
31
-
32
-
33
-
34
-
35
-
36
-
37
-
38
-
39
-
40
-
41
-
42
-
43
-
44
-
45
-
46
-
47
-
48
-
49
-
50
-
51
-
52
-
53
-
54
-
55
-
56
-
57
-
58
-
59
-
60
-
61
-
62
-
63
-
64
-
65
-
66
-
67
-
68
-
69
-
70
-
71
-
72
-
73
-
74
-
75
-
76
-
77
-
78
-
79
-
80
-
81
-
82
-
83
-
84
-
85
-
86
-
87
-
88
-
89
-
90
-
91
-
92
-
93
-
94
-
95
-
96
-
97
-
98
-
99
-
100
-
101
-
102
-
103
-
104
-
105
-
106
-
107
-
108
-
109
-
110
-
111
-
112
-
113
-
114
-
115
-
116
-
117
-
118
-
119
-
120
-
121
-
122
-
123
-
124
-
125
-
126
-
127
-
128
-
129
-
130
-
131
-
132
-
133
-
134
-
135
-
136
-
137
-
138
-
139
-
140
-
141
-
142
-
143
-
144
-
145
-
146
-
147
-
148
-
149
-
150
-
151
-
152
-
153
-
154
-
155
-
156
-
157
-
158
-
159
-
160
-
161
-
162
-
163
-
164
-
165
-
166
-
167
-
168
-
169
-
170
-
171
-
172
-
173
-
174
-
175
-
176
-
177
-
178
-
179
-
180
-
181
-
182
-
183
-
184
-
185
-
186
-
187
-
188
-
189
-
190
-
191
-
192
-
193
-
194
-
195
-
196
-
197
-
198
-
199
 |
 |

13
RBS – Interim Results 2015
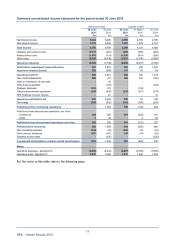
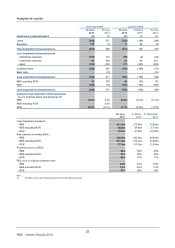
Summary consolidated balance sheet as at 30 June 2015
30 June 31 March 31 December
2015 2015 2014
£m £m £m
Cash and balances at central banks 81,900 75,521 74,872
Net loans and advances to banks (1,2) 20,714 25,002 23,027
Net loans and advances to customers (1,2) 314,993 333,173 334,251
Reverse repurchase agreements and stock borrowing 67,606 69,400 64,695
Debt securities and equity shares 80,550 85,557 92,284
A
ssets of disposal groups (3) 89,071 93,673 82,011
Other assets 28,010 31,721 26,033
Funded assets 682,844 714,047 697,173
Derivatives 281,857 390,565 353,590
Total assets 964,701 1,104,612 1,050,763
Bank deposits (2,4) 30,978 37,235 35,806
Customer deposits (2,4) 342,023 349,289 354,288
Repurchase agreements and stock lending 66,362 69,383 62,210
Debt securities in issue 41,819 45,855 50,280
Subordinated liabilities 19,683 22,004 22,905
Derivatives 273,589 386,056 349,805
Liabilities of disposal groups (3) 80,388 85,244 71,320
Other liabilities 48,090 47,265 43,957
Total liabilities 902,932 1,042,331 990,571
Non-controlling interests 5,705 5,473 2,946
Owners’ equity 56,064 56,808 57,246
Total liabilities and equity 964,701 1,104,612 1,050,763
Notes:
(1) Excludes reverse repurchase agreements and stock borrowing.
(2) Excludes disposal groups.
(3) Primarily Citizens and International Private Banking in 2015 and Citizens at 31 December 2014 - refer to Note 13 on page 91.
(4) Excludes repurchase agreements and stock lending.