RBS 2014 Annual Report Download - page 158
Download and view the complete annual report
Please find page 158 of the 2014 RBS annual report below. You can navigate through the pages in the report by either clicking on the pages listed below, or by using the keyword search tool below to find specific information within the annual report.-
 1
1 -
2
-
3
-
4
-
5
-
6
-
7
-
8
-
9
-
10
-
11
-
12
-
13
-
14
-
15
-
16
-
17
-
18
-
19
-
20
-
21
-
22
-
23
-
24
-
25
-
26
-
27
-
28
-
29
-
30
-
31
-
32
-
33
-
34
-
35
-
36
-
37
-
38
-
39
-
40
-
41
-
42
-
43
-
44
-
45
-
46
-
47
-
48
-
49
-
50
-
51
-
52
-
53
-
54
-
55
-
56
-
57
-
58
-
59
-
60
-
61
-
62
-
63
-
64
-
65
-
66
-
67
-
68
-
69
-
70
-
71
-
72
-
73
-
74
-
75
-
76
-
77
-
78
-
79
-
80
-
81
-
82
-
83
-
84
-
85
-
86
-
87
-
88
-
89
-
90
-
91
-
92
-
93
-
94
-
95
-
96
-
97
-
98
-
99
-
100
-
101
-
102
-
103
-
104
-
105
-
106
-
107
-
108
-
109
-
110
-
111
-
112
-
113
-
114
-
115
-
116
-
117
-
118
-
119
-
120
-
121
-
122
-
123
-
124
-
125
-
126
-
127
-
128
-
129
-
130
-
131
-
132
-
133
-
134
-
135
-
136
-
137
-
138
-
139
-
140
-
141
-
142
-
143
-
144
-
145
-
146
-
147
-
 148
148 -
 149
149 -
 150
150 -
 151
151 -
 152
152 -
 153
153 -
 154
154 -
 155
155 -
 156
156 -
 157
157 -
 158
158 -
 159
159 -
 160
160 -
 161
161 -
 162
162 -
 163
163 -
 164
164 -
 165
165 -
 166
166 -
 167
167 -
 168
168 -
169
-
170
-
171
-
172
-
173
-
174
-
175
-
176
-
177
-
178
-
179
-
180
-
181
-
182
-
183
-
184
-
185
-
186
-
187
-
188
-
189
-
190
-
191
-
192
-
193
-
194
-
195
-
196
-
197
-
198
-
199
 |
 |
23
RBS – Interim Results 2015
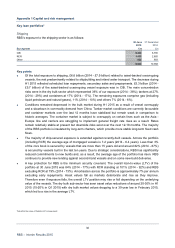
Appendix 1 Capital and risk management
Debt securities (continued)
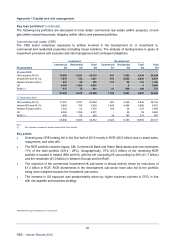
Key points
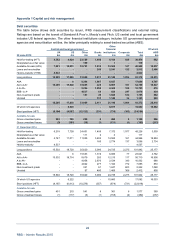
• HFT: Holdings of government and ABS decreased, principally in US bonds, following continuing exits
from US asset-backed products business, focus on balance sheet and RWA reduction and risk
mitigation. The decrease in other government bonds was driven by a decrease in Germany as bund
yields reached historic lows in Q1 2015, largely offset by higher Japanese treasury bills, reflecting
favourable rates, used for collateral upgrades. The increase in short positions (largely Italy, German
y
and Spain) reflected hedging of reverse repo collateral following liquidity concerns and uncertaint
y
around Greece. The increase in UK government short positions reflected positioning ahead o
f
expected interest rate rise.
•
A
FS: Holdings of UK and US government bonds increased due to purchases by Treasury reflecting
liquidity portfolio mix management and price optimisation. CFG switched from asset-backed securities
to US government bonds as part of RWA and liquidity coverage ratio management.
• Market concerns and consequent lower bond prices resulted in lower gross unrealised gains and
higher gross unrealised losses relating to AFS debt securities. Lower gains also reflected sales and
redemptions in Treasury.
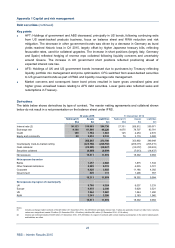
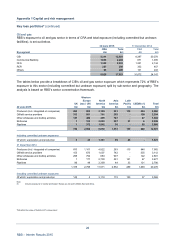
Derivatives
The table below shows derivatives by type of contract. The master netting agreements and collateral shown
below do not result in a net presentation on the balance sheet under IFRS.
30 June 2015 31 December 2014
Notional (1)
A
ssets Liabilities Notional (1) Assets Liabilities
£bn £m £m £bn £m £m
Interest rate (2) 20,123 216,983 204,738 27,331 269,912 259,971
Exchange rate 4,196 61,566 65,228 4,675 78,707 83,781
Credit 100 1,704 1,681 125 2,254 2,615
Equity and commodity 60 2,032 2,133 78 3,119 3,582
282,285 273,780 353,992 349,949
Counterparty mark-to-market netting (228,780) (228,780) (295,315) (295,315)
Cash collateral (28,295) (25,627) (33,272) (30,203)
Securities collateral (6,999) (8,299) (7,013) (14,437)
Net exposure 18,211 11,074 18,392 9,994
Net exposure by sector
Banks 1,357 2,065 1,875 1,534
Other financial institutions 6,205 5,313 4,035 3,721
Corporate 9,820 3,585 11,186 4,382
Government 829 111 1,296 357
18,211 11,074 18,392 9,994
Net exposure by region of counterparty
UK 9,708 4,524 9,037 3,233
Europe 4,818 2,395 5,628 3,521
US 1,344 1,867 1,544 1,280
RoW 2,341 2,288 2,183 1,960
18,211 11,074 18,392 9,994
Notes:
(1) Includes exchange traded contracts of £2,620 billion (31 December 2014 - £2,436 billion) principally interest rate. Trades are generally closed out daily hence carrying
values were insignificant; assets £3 million (31 December 2014 - £8 million); liabilities £81 million (31 December 2014 - £119 million).
(2) Interest rate notional includes £12,007 billion (31 December 2014 - £18,452 billion) in respect of contracts with central clearing counterparties to the extent related assets
and liabilities are offset.