RBS 2014 Annual Report Download - page 150
Download and view the complete annual report
Please find page 150 of the 2014 RBS annual report below. You can navigate through the pages in the report by either clicking on the pages listed below, or by using the keyword search tool below to find specific information within the annual report.-
 1
1 -
2
-
3
-
4
-
5
-
6
-
7
-
8
-
9
-
10
-
11
-
12
-
13
-
14
-
15
-
16
-
17
-
18
-
19
-
20
-
21
-
22
-
23
-
24
-
25
-
26
-
27
-
28
-
29
-
30
-
31
-
32
-
33
-
34
-
35
-
36
-
37
-
38
-
39
-
40
-
41
-
42
-
43
-
44
-
45
-
46
-
47
-
48
-
49
-
50
-
51
-
52
-
53
-
54
-
55
-
56
-
57
-
58
-
59
-
60
-
61
-
62
-
63
-
64
-
65
-
66
-
67
-
68
-
69
-
70
-
71
-
72
-
73
-
74
-
75
-
76
-
77
-
78
-
79
-
80
-
81
-
82
-
83
-
84
-
85
-
86
-
87
-
88
-
89
-
90
-
91
-
92
-
93
-
94
-
95
-
96
-
97
-
98
-
99
-
100
-
101
-
102
-
103
-
104
-
105
-
106
-
107
-
108
-
109
-
110
-
111
-
112
-
113
-
114
-
115
-
116
-
117
-
118
-
119
-
120
-
121
-
122
-
123
-
124
-
125
-
126
-
127
-
128
-
129
-
130
-
131
-
132
-
133
-
134
-
135
-
136
-
137
-
138
-
139
-
 140
140 -
 141
141 -
 142
142 -
 143
143 -
 144
144 -
 145
145 -
 146
146 -
 147
147 -
 148
148 -
 149
149 -
 150
150 -
 151
151 -
 152
152 -
 153
153 -
 154
154 -
 155
155 -
 156
156 -
 157
157 -
 158
158 -
 159
159 -
 160
160 -
161
-
162
-
163
-
164
-
165
-
166
-
167
-
168
-
169
-
170
-
171
-
172
-
173
-
174
-
175
-
176
-
177
-
178
-
179
-
180
-
181
-
182
-
183
-
184
-
185
-
186
-
187
-
188
-
189
-
190
-
191
-
192
-
193
-
194
-
195
-
196
-
197
-
198
-
199
 |
 |
15
RBS – Interim Results 2015
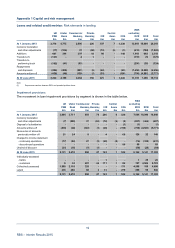
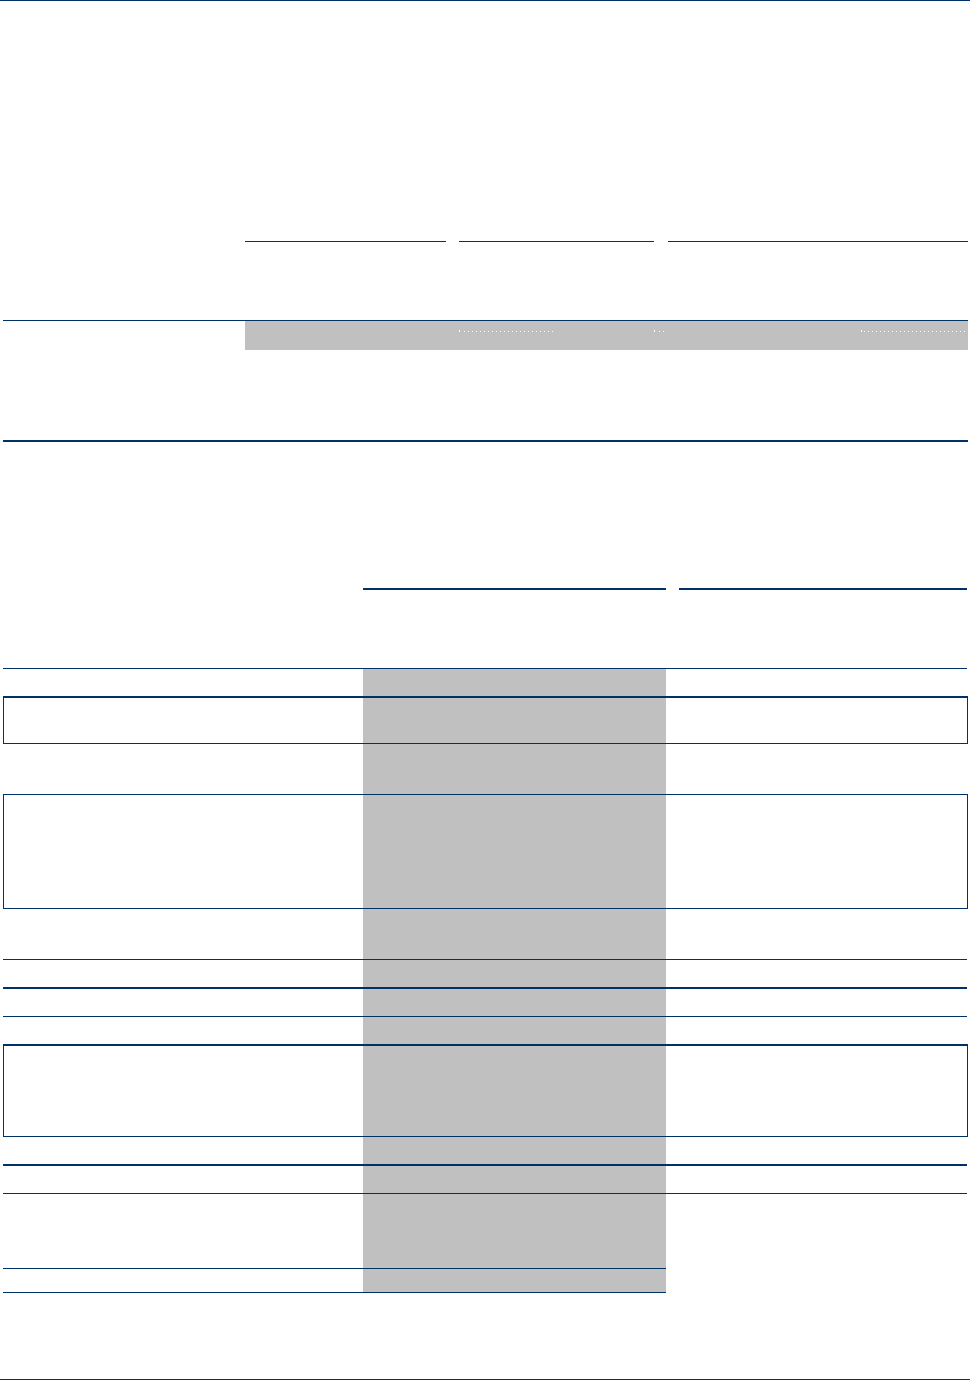
Appendix 1 Capital and risk management
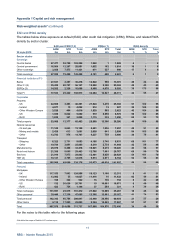
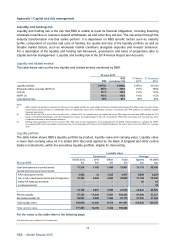
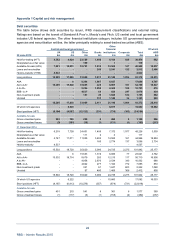
Funding risk
The composition of RBS’s balance sheet is a function of the broad array of product offerings and diverse
markets served by its businesses. Active management of both asset and liability portfolios is designed to
optimise the liquidity profile, while ensuring adequate coverage of all cash requirements under extreme
stress conditions.
The table below summarises the key funding metrics.
Short-term wholesale Total wholesale Net inter-bank
funding (1) funding
funding (2)
Excluding Including Excluding Including Net
derivative derivative derivative derivative inter-bank
collateral collateral collateral collateral Deposits Loans (3) funding
£bn £bn £bn £bn £bn £bn £bn
30 June 2015 25.0 47.0 76.4 98.4 13.5 (12.3) 1.2
31 March 2015 27.2 55.3 84.0 112.1 14.3 (14.8) (0.5)
31 December 2014 27.8 53.3 90.5 116.0 15.4 (13.3) 2.1
30 September 2014 31.4 53.9 94.4 116.9 16.5 (18.2) (1.7)
30 June 2014 33.6 55.1 101.6 123.1 17.7 (19.3) (1.6)
Notes:
(1) Short-term wholesale funding is funding with a residual maturity of less than one year.
(2) Excludes derivative cash collateral.
(3) Principally short-term balances.
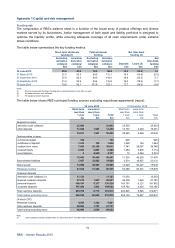
The table below shows RBS’s principal funding sources excluding repurchase agreements (repos).
30 June 2015 31 December 2014
Short-term Long-term Short-term Long-term
less than more than less than more than
1 year 1 year Total 1 year 1 year Total
£m £m £m £m £m £m
Deposits by banks
derivative cash collateral 21,993 - 21,993 25,503 - 25,503
other deposits 11,938 1,521 13,459 13,137 2,294 15,431
33,931 1,521 35,452 38,640 2,294 40,934
Debt securities in issue
commercial paper 154 - 154 625 - 625
certificates of deposit 1,413 196 1,609 1,695 149 1,844
medium-term notes 7,842 22,199 30,041 7,741 29,007 36,748
covered bonds 2,625 3,861 6,486 1,284 5,830 7,114
securitisations 8 4,699 4,707 10 5,564 5,574
12,042 30,955 42,997 11,355 40,550 51,905
Subordinated liabilities 1,057 18,852 19,909 3,274 19,857 23,131
Notes issued 13,099 49,807 62,906 14,629 60,407 75,036
Wholesale funding 47,030 51,328 98,358 53,269 62,701 115,970
Customer deposits
derivative cash collateral (1) 11,133 - 11,133 13,003 - 13,003
financial institution deposits 47,274 1,547 48,821 46,359 1,422 47,781
personal deposits 188,191 5,337 193,528 185,781 6,121 191,902
corporate deposits 157,200 1,832 159,032 159,782 2,403 162,185
Total customer deposits 403,798 8,716 412,514 404,925 9,946 414,871
Total funding excluding repos 450,828 60,044 510,872 458,194 72,647 530,841
Of which CFG:
Wholesale funding 4,529 1,332 5,861
Total customer deposits 62,064 1,727 63,791
Total funding excluding repos 66,593 3,059 69,652
Note:
(1) Cash collateral includes £10,220 million (31 December 2014 - £12,036 million) from financial institutions.