RBS 2014 Annual Report Download - page 171
Download and view the complete annual report
Please find page 171 of the 2014 RBS annual report below. You can navigate through the pages in the report by either clicking on the pages listed below, or by using the keyword search tool below to find specific information within the annual report.-
 1
1 -
2
-
3
-
4
-
5
-
6
-
7
-
8
-
9
-
10
-
11
-
12
-
13
-
14
-
15
-
16
-
17
-
18
-
19
-
20
-
21
-
22
-
23
-
24
-
25
-
26
-
27
-
28
-
29
-
30
-
31
-
32
-
33
-
34
-
35
-
36
-
37
-
38
-
39
-
40
-
41
-
42
-
43
-
44
-
45
-
46
-
47
-
48
-
49
-
50
-
51
-
52
-
53
-
54
-
55
-
56
-
57
-
58
-
59
-
60
-
61
-
62
-
63
-
64
-
65
-
66
-
67
-
68
-
69
-
70
-
71
-
72
-
73
-
74
-
75
-
76
-
77
-
78
-
79
-
80
-
81
-
82
-
83
-
84
-
85
-
86
-
87
-
88
-
89
-
90
-
91
-
92
-
93
-
94
-
95
-
96
-
97
-
98
-
99
-
100
-
101
-
102
-
103
-
104
-
105
-
106
-
107
-
108
-
109
-
110
-
111
-
112
-
113
-
114
-
115
-
116
-
117
-
118
-
119
-
120
-
121
-
122
-
123
-
124
-
125
-
126
-
127
-
128
-
129
-
130
-
131
-
132
-
133
-
134
-
135
-
136
-
137
-
138
-
139
-
140
-
141
-
142
-
143
-
144
-
145
-
146
-
147
-
148
-
149
-
150
-
151
-
152
-
153
-
154
-
155
-
156
-
157
-
158
-
159
-
160
-
 161
161 -
 162
162 -
 163
163 -
 164
164 -
 165
165 -
 166
166 -
 167
167 -
 168
168 -
 169
169 -
 170
170 -
 171
171 -
 172
172 -
 173
173 -
 174
174 -
 175
175 -
 176
176 -
 177
177 -
 178
178 -
 179
179 -
 180
180 -
 181
181 -
182
-
183
-
184
-
185
-
186
-
187
-
188
-
189
-
190
-
191
-
192
-
193
-
194
-
195
-
196
-
197
-
198
-
199
 |
 |

36
RBS – Interim Results 2015
Appendix 1 Capital and risk management
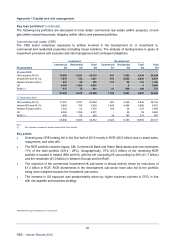
Non-trading portfolios
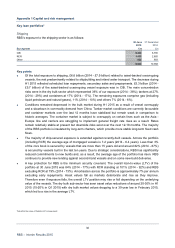
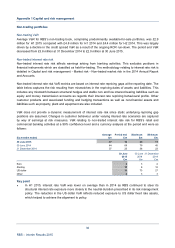
Non-trading VaR
Average VaR for RBS’s non-trading book, comprising predominantly available-for-sale portfolios, was £2.9
million for H1 2015 compared with £4.8 million for H1 2014 and £4.4 million for H2 2014. This was largely
driven by a decline in the credit spread VaR as a result of the ongoing RCR run-down. The period end VaR
decreased from £3.8 million at 31 December 2014 to £2.0 million at 30 June 2015.
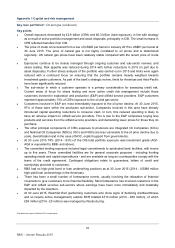
Non-traded interest rate risk
Non-traded interest rate risk affects earnings arising from banking activities. This excludes positions in
financial instruments which are classified as held-for-trading. The methodology relating to interest rate risk is
detailed in Capital and risk management - Market risk - Non-traded market risk in the 2014 Annual Report
and Accounts.
Non-traded interest rate risk VaR metrics are based on interest rate repricing gaps at the reporting date. The
table below captures the risk resulting from mismatches in the repricing dates of assets and liabilities. This
includes any mismatch between structural hedges and stable non and low interest bearing liabilities such as
equity and money transmission accounts as regards their interest rate repricing behavioural profile. Other
customer products and associated funding and hedging transactions as well as non-financial assets and
liabilities such as property, plant and equipment are also included.
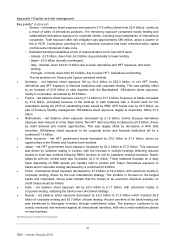
VaR does not provide a dynamic measurement of interest rate risk since static underlying repricing gap
positions are assumed. Changes in customer behaviour under varying interest rate scenarios are captured
by way of earnings at risk measures. VaR relating to non-traded interest rate risk for RBS’s retail and
commercial banking activities at a 99% confidence level and a currency analysis at the period end were as
follows:
Average Period end Maximum Minimum
Six months ended £m £m £m £m
30 June 2015 17 13 25 11
30 June 2014 64 68 79 45
31 December 2014 37 23 56 23
30 June 30 June 31 Decembe
r
2015 2014 2014
£m £m £m
Euro 2 3 2
Sterling 13 8 12
US dollar 14 73 27
Other 4 3 3
Key point
• In H1 2015, interest rate VaR was lower on average than in 2014 as RBS continued to steer its
structural interest rate exposure more closely to the neutral duration prescribed in its risk management
policy. The reduction in the US dollar VaR reflects reduced exposure to US dollar fixed rate assets,
which helped to achieve the alignment to policy.