RBS 2014 Annual Report Download - page 195
Download and view the complete annual report
Please find page 195 of the 2014 RBS annual report below. You can navigate through the pages in the report by either clicking on the pages listed below, or by using the keyword search tool below to find specific information within the annual report.-
 1
1 -
2
-
3
-
4
-
5
-
6
-
7
-
8
-
9
-
10
-
11
-
12
-
13
-
14
-
15
-
16
-
17
-
18
-
19
-
20
-
21
-
22
-
23
-
24
-
25
-
26
-
27
-
28
-
29
-
30
-
31
-
32
-
33
-
34
-
35
-
36
-
37
-
38
-
39
-
40
-
41
-
42
-
43
-
44
-
45
-
46
-
47
-
48
-
49
-
50
-
51
-
52
-
53
-
54
-
55
-
56
-
57
-
58
-
59
-
60
-
61
-
62
-
63
-
64
-
65
-
66
-
67
-
68
-
69
-
70
-
71
-
72
-
73
-
74
-
75
-
76
-
77
-
78
-
79
-
80
-
81
-
82
-
83
-
84
-
85
-
86
-
87
-
88
-
89
-
90
-
91
-
92
-
93
-
94
-
95
-
96
-
97
-
98
-
99
-
100
-
101
-
102
-
103
-
104
-
105
-
106
-
107
-
108
-
109
-
110
-
111
-
112
-
113
-
114
-
115
-
116
-
117
-
118
-
119
-
120
-
121
-
122
-
123
-
124
-
125
-
126
-
127
-
128
-
129
-
130
-
131
-
132
-
133
-
134
-
135
-
136
-
137
-
138
-
139
-
140
-
141
-
142
-
143
-
144
-
145
-
146
-
147
-
148
-
149
-
150
-
151
-
152
-
153
-
154
-
155
-
156
-
157
-
158
-
159
-
160
-
161
-
162
-
163
-
164
-
165
-
166
-
167
-
168
-
169
-
170
-
171
-
172
-
173
-
174
-
175
-
176
-
177
-
178
-
179
-
180
-
181
-
182
-
183
-
184
-
 185
185 -
 186
186 -
 187
187 -
 188
188 -
 189
189 -
 190
190 -
 191
191 -
 192
192 -
 193
193 -
 194
194 -
 195
195 -
 196
196 -
 197
197 -
 198
198 -
 199
199
 |
 |

2
RBS – Interim Results 2015
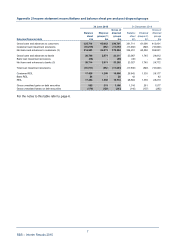
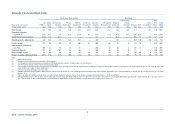
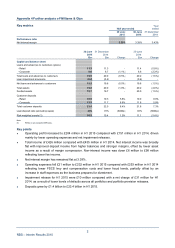
Appendix 4 Further analysis of Williams & Glyn
Key metrics Yea
r
Half year ended Half year ended ended
30 June 30 June 31 Decembe
r
2015 2014 2014
Performance ratio
Net interest margin 3.39% 3.39% 3.43%
30 June 31 Decembe
r
30 June
2015 2014 2014
£bn £bn Change £bn Change
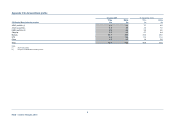
Capital and balance sheet
Loans and advances to customers (gross)
- Retail 11.3 11.3 - 11.4 (0.9%)
- Corporate 8.6 8.7 (1.1%) 8.8 (2.3%)
Total loans and advances to customers 19.9 20.0 (0.5%) 20.2 (1.5%)
Loan impairment provisions (0.4) (0.4) - (0.4) -
Net loans and advances to customers 19.5 19.6 (0.5%) 19.8 (1.5%)
Total assets 19.8 20.0 (1.0%) 20.2 (2.0%)
Funded assets 19.7 19.7 - 20.0 (1.5%)
Customer deposits
- Retail 10.9 10.3 5.8% 10.0 9.0%
- Corporate 12.5 11.7 6.8% 11.8 5.9%
Total customer deposits 23.4 22.0 6.4% 21.8 7.3%
Loan:deposit ratio (excluding repos) 85% 91% (600bp) 93% (800bp)
Risk-weighted assets (1) 10.5 10.4 1.0% 11.1 (5.4%)
Note:
(1) RWAs on an end-point CRR basis.
Key points
• Operating profit increased to £204 million in H1 2015 compared with £151 million in H1 2014, driven
mainly by lower operating expenses and net impairment releases.
• Total income of £426 million compared with £435 million in H1 2014. Net interest income was broadly
flat with improved deposit income from higher balances and stronger margins, offset by lower asset
income as a result of margin compression. Non-interest income was down £6 million to £98 million
reflecting lower fee income.
• Net interest margin has remained flat at 3.39%.
• Operating expenses fell £21 million to £232 million in H1 2015 compared with £253 million in H1 2014
reflecting lower FSCS levy and compensation costs and lower fraud levels, partially offset by an
increase in staff expenses as the business prepares for divestment.
• Impairment release for H1 2015 were £10 million compared with a net charge of £31 million for H1
2014, as a result of lower levels of defaults across all portfolios and portfolio provision releases.
• Deposits grew by £1.4 billion to £23.4 billion in H1 2015.