RBS 2014 Annual Report Download - page 85
Download and view the complete annual report
Please find page 85 of the 2014 RBS annual report below. You can navigate through the pages in the report by either clicking on the pages listed below, or by using the keyword search tool below to find specific information within the annual report.-
 1
1 -
2
-
3
-
4
-
5
-
6
-
7
-
8
-
9
-
10
-
11
-
12
-
13
-
14
-
15
-
16
-
17
-
18
-
19
-
20
-
21
-
22
-
23
-
24
-
25
-
26
-
27
-
28
-
29
-
30
-
31
-
32
-
33
-
34
-
35
-
36
-
37
-
38
-
39
-
40
-
41
-
42
-
43
-
44
-
45
-
46
-
47
-
48
-
49
-
50
-
51
-
52
-
53
-
54
-
55
-
56
-
57
-
58
-
59
-
60
-
61
-
62
-
63
-
64
-
65
-
66
-
67
-
68
-
69
-
70
-
71
-
72
-
73
-
74
-
 75
75 -
 76
76 -
 77
77 -
 78
78 -
 79
79 -
 80
80 -
 81
81 -
 82
82 -
 83
83 -
 84
84 -
 85
85 -
 86
86 -
 87
87 -
 88
88 -
 89
89 -
 90
90 -
 91
91 -
 92
92 -
 93
93 -
 94
94 -
 95
95 -
96
-
97
-
98
-
99
-
100
-
101
-
102
-
103
-
104
-
105
-
106
-
107
-
108
-
109
-
110
-
111
-
112
-
113
-
114
-
115
-
116
-
117
-
118
-
119
-
120
-
121
-
122
-
123
-
124
-
125
-
126
-
127
-
128
-
129
-
130
-
131
-
132
-
133
-
134
-
135
-
136
-
137
-
138
-
139
-
140
-
141
-
142
-
143
-
144
-
145
-
146
-
147
-
148
-
149
-
150
-
151
-
152
-
153
-
154
-
155
-
156
-
157
-
158
-
159
-
160
-
161
-
162
-
163
-
164
-
165
-
166
-
167
-
168
-
169
-
170
-
171
-
172
-
173
-
174
-
175
-
176
-
177
-
178
-
179
-
180
-
181
-
182
-
183
-
184
-
185
-
186
-
187
-
188
-
189
-
190
-
191
-
192
-
193
-
194
-
195
-
196
-
197
-
198
-
199
 |
 |
83
RBS – Interim Results 2015
Notes
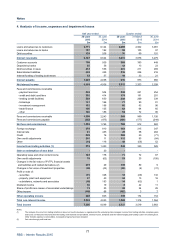
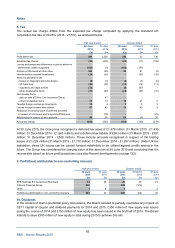
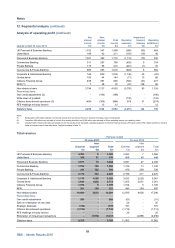
8. Tax
The actual tax charge differs from the expected tax charge computed by applying the standard UK
corporation tax rate of 20.25% (2014 - 21.5%), as analysed below.
Half year ended Quarter ended
30 June 30 June 30 June 31 March 30 June
2015 2014 2015 2015 2014
£m £m £m £m £m
Profit before tax 293 2,226 240 53 736
Expected tax charge (59) (478) (48) (11) (158)
Losses and temporary differences in period where no
deferred tax asset recognised (369) (9) (182) (187) -
Foreign profits taxed at other rates 165 (38) 84 81 (2)
Non-deductible goodwill impairment (25) (28) - (25) (28)
Items not allowed for tax
- losses on disposals and write-downs (9) (5) (2) (7) (5)
- UK bank levy (28) (30) (14) (14) (11)
- regulatory and legal actions (72) - (5) (67) -
- other disallowable items (51) (69) (24) (27) (41)
Non-taxable items
- gain on sale of Direct Line Insurance Group - 41 - - -
- other non-taxable items 37 13 16 21 5
Taxable foreign exchange movements 12 4 7 5 3
Losses brought forward and utilised 57 45 14 43 9
Reduction in carrying value of deferred tax asset
in respect of US losses and temporary differences - (76) - - (76)
A
djustments in respect of prior periods 49 38 54 (5) 26
A
ctual tax charge (293) (592) (100) (193) (278)
At 30 June 2015, the Group has recognised a deferred tax asset of £1,479 million (31 March 2015 - £1,430
million; 31 December 2014 - £1,540 million) and a deferred tax liability of £363 million (31 March 2015 - £381
million; 31 December 2014 - £500 million). These include amounts recognised in respect of UK trading
losses of £1,229 million (31 March 2015 - £1,170 million; 31 December 2014 - £1,257 million). Under UK tax
legislation, these UK losses can be carried forward indefinitely to be utilised against profits arising in the
future. The Group has considered the carrying value of this asset as at 30 June 2015 and concluded that it is
recoverable based on future profit projections (see also Recent developments on page 122).
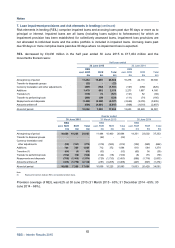
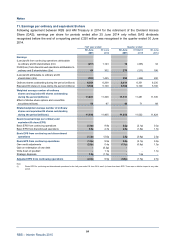
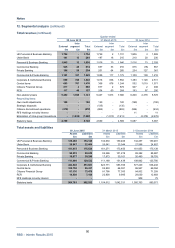
9. Profit/(loss) attributable to non-controlling interests
Half year ended Quarter ended
30 June 30 June 30 June 31 March 30 June
2015 2014 2015 2015 2014
£m £m £m £m £m
RFS Holdings BV Consortium Members 53 38 28 25 21
Citizens Financial Group 290 - 399 (109) -
Other 14 1 - 2
Profit/(loss) attributable to non-controlling interests 344 42 428 (84) 23
10. Dividends
In the context of macro-prudential policy discussions, the Board decided to partially neutralise any impact on
CET1 capital of coupon and dividend payments for 2014 and 2015. £300 million of new equity was issued
during the course of 2014 and £150 million of new equity has been issued in the first half of 2015. The Board
intends to issue £300 million of new equity in total during 2015 to achieve this aim.