RBS 2014 Annual Report Download - page 45
Download and view the complete annual report
Please find page 45 of the 2014 RBS annual report below. You can navigate through the pages in the report by either clicking on the pages listed below, or by using the keyword search tool below to find specific information within the annual report.-
 1
1 -
2
-
3
-
4
-
5
-
6
-
7
-
8
-
9
-
10
-
11
-
12
-
13
-
14
-
15
-
16
-
17
-
18
-
19
-
20
-
21
-
22
-
23
-
24
-
25
-
26
-
27
-
28
-
29
-
30
-
31
-
32
-
33
-
34
-
 35
35 -
 36
36 -
 37
37 -
 38
38 -
 39
39 -
 40
40 -
 41
41 -
 42
42 -
 43
43 -
 44
44 -
 45
45 -
 46
46 -
 47
47 -
 48
48 -
 49
49 -
 50
50 -
 51
51 -
 52
52 -
 53
53 -
 54
54 -
 55
55 -
56
-
57
-
58
-
59
-
60
-
61
-
62
-
63
-
64
-
65
-
66
-
67
-
68
-
69
-
70
-
71
-
72
-
73
-
74
-
75
-
76
-
77
-
78
-
79
-
80
-
81
-
82
-
83
-
84
-
85
-
86
-
87
-
88
-
89
-
90
-
91
-
92
-
93
-
94
-
95
-
96
-
97
-
98
-
99
-
100
-
101
-
102
-
103
-
104
-
105
-
106
-
107
-
108
-
109
-
110
-
111
-
112
-
113
-
114
-
115
-
116
-
117
-
118
-
119
-
120
-
121
-
122
-
123
-
124
-
125
-
126
-
127
-
128
-
129
-
130
-
131
-
132
-
133
-
134
-
135
-
136
-
137
-
138
-
139
-
140
-
141
-
142
-
143
-
144
-
145
-
146
-
147
-
148
-
149
-
150
-
151
-
152
-
153
-
154
-
155
-
156
-
157
-
158
-
159
-
160
-
161
-
162
-
163
-
164
-
165
-
166
-
167
-
168
-
169
-
170
-
171
-
172
-
173
-
174
-
175
-
176
-
177
-
178
-
179
-
180
-
181
-
182
-
183
-
184
-
185
-
186
-
187
-
188
-
189
-
190
-
191
-
192
-
193
-
194
-
195
-
196
-
197
-
198
-
199
 |
 |

43
RBS – Interim Results 2015
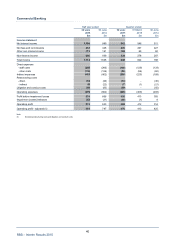
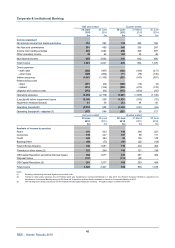
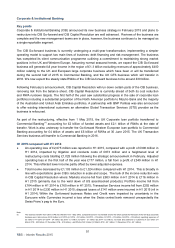
Commercial Banking
Key points
Commercial Banking made a strong start to the year with the business continuing to make a significant
contribution to overall bank profitability, whilst focussing on customer service, trust and advocacy. Continued
simplification of processes, as well as investment in technology and relationship managers has contributed
to organic H1 2015 net lending growth of £0.5 billion.
•
A
s the business continues to focus on supporting the UK economy, special emphasis is being placed
on supporting businesses with a turnover of between £10 million and £50 million or borrowing in
excess of £1 million.
• Commercial Banking continued to simplify its customer proposition; improvements in account opening
have delivered a 75% reduction in customer paperwork and a 25% reduction in the time to open an
account.
• Further investment in relationship managers included the introduction of a new Customer Relationship
Management tool for 3,000 staff, enabling a more coherent view of all customer needs. In addition,
2,800 staff registered for a bespoke lending skills training programme.
• During H1 complaints reduced by 21%, highlighting the success of the franchise’s focus on custome
r
service, delivered through empowering staff, enhancing capability and process simplification.
On 1 January 2015, the Private Banking RBSI business was transferred to Commercial Banking, accounting
for £31 million of operating profit in the half year, followed on 1 May 2015 by the Corporate & Institutional
Banking UK coverage business, accounting for £13 million of operating profit from the date of transfer. On 1
August 2014, Commercial Cards for UK Personal & Business Banking related customers, with revenue of
£22 million, was transferred to UK Personal & Business Banking. The transferred businesses affect
comparisons with prior periods. (1)
H1 2015 compared with H1 2014
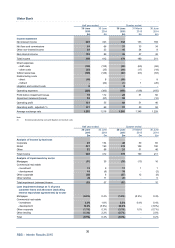
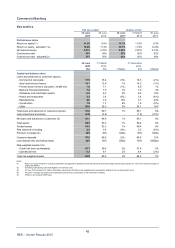
• Commercial Banking recorded an operating profit of £812 million compared with £635 million in the
comparative period. Adjusted operating profit was £889 million, compared with £747 million in H1
2014, with income up 9%. Return on equity improved 2.1 percentage points to 11.6%.
• Total income was £1,714 million, compared with £1,568 million in the prior year. Net interest income
increased by £109 million to £1,108 million, driven by increased deposits and asset volumes and
higher deposit margins, partially offset by lower asset margins. Non-interest income increased £37
million to £606 million mostly reflecting higher gains on equity disposals.
• Operating expenses decreased £27 million to £875 million, principally from lower restructuring costs,
and lower headcount. This was partially offset by higher litigation and conduct costs of £59 million, up
£9 million, primarily a top-up for interest rate hedging product provisions.
• Net impairment losses decreased £4 million to £27 million driven by reduced individual and collective
charges, down £51 million, offsetting lower net latent releases.
• Headline net loans and advances to customers increased by £5.0 billion from December 2014 to
£90.1 billion, including £4.5 billion from the transferred businesses. Underlying gross lending
compared with H1 2014 was up £1.4 billion.
• Deposits were £97.0 billion at 30 June 2015, including £6.4 billion from the transferred businesses,
with organic deposit growth of £3.8 billion from 31 December 2014.
• RWAs increased by £3.9 billion year-on-year to £66.9 billion, including £3.8 billion from the transferred
businesses.
Note:
(1) The business transfer included: total income of £108 million (H1 2014 - £78 million; Q2 2015 - £56 million; Q1 2015 - £53 million; Q2 2014 - £42 million); operating
expenses of £46 million (H1 2014 - £57 million; Q2 2015 - £24 million; Q1 2015 - £21 million; Q2 2014 - £30 million); net loans and advances to customers of £4.5 billion
(31 March 2015 - £4.4 billion; 31 December 2014 - £4.4 billion); customer deposits of £6.4 billion (31 March 2015 - £6.2 billion; 31 December 2014 - £6.5 billion); and
RWAs of £3.8 billion (31 March 2015 - £3.6 billion; 31 December 2014 - £3.5 billion). Comparatives have not been restated.