RBS 2014 Annual Report Download - page 69
Download and view the complete annual report
Please find page 69 of the 2014 RBS annual report below. You can navigate through the pages in the report by either clicking on the pages listed below, or by using the keyword search tool below to find specific information within the annual report.-
 1
1 -
2
-
3
-
4
-
5
-
6
-
7
-
8
-
9
-
10
-
11
-
12
-
13
-
14
-
15
-
16
-
17
-
18
-
19
-
20
-
21
-
22
-
23
-
24
-
25
-
26
-
27
-
28
-
29
-
30
-
31
-
32
-
33
-
34
-
35
-
36
-
37
-
38
-
39
-
40
-
41
-
42
-
43
-
44
-
45
-
46
-
47
-
48
-
49
-
50
-
51
-
52
-
53
-
54
-
55
-
56
-
57
-
58
-
 59
59 -
 60
60 -
 61
61 -
 62
62 -
 63
63 -
 64
64 -
 65
65 -
 66
66 -
 67
67 -
 68
68 -
 69
69 -
 70
70 -
 71
71 -
 72
72 -
 73
73 -
 74
74 -
 75
75 -
 76
76 -
 77
77 -
 78
78 -
 79
79 -
80
-
81
-
82
-
83
-
84
-
85
-
86
-
87
-
88
-
89
-
90
-
91
-
92
-
93
-
94
-
95
-
96
-
97
-
98
-
99
-
100
-
101
-
102
-
103
-
104
-
105
-
106
-
107
-
108
-
109
-
110
-
111
-
112
-
113
-
114
-
115
-
116
-
117
-
118
-
119
-
120
-
121
-
122
-
123
-
124
-
125
-
126
-
127
-
128
-
129
-
130
-
131
-
132
-
133
-
134
-
135
-
136
-
137
-
138
-
139
-
140
-
141
-
142
-
143
-
144
-
145
-
146
-
147
-
148
-
149
-
150
-
151
-
152
-
153
-
154
-
155
-
156
-
157
-
158
-
159
-
160
-
161
-
162
-
163
-
164
-
165
-
166
-
167
-
168
-
169
-
170
-
171
-
172
-
173
-
174
-
175
-
176
-
177
-
178
-
179
-
180
-
181
-
182
-
183
-
184
-
185
-
186
-
187
-
188
-
189
-
190
-
191
-
192
-
193
-
194
-
195
-
196
-
197
-
198
-
199
 |
 |

67
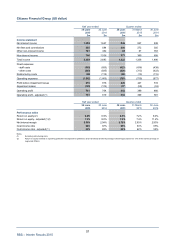
RBS – Interim Results 2015
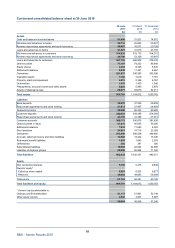
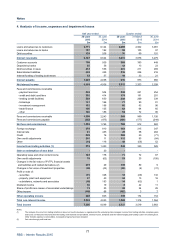
Condensed consolidated income statement for the period ended 30 June 2015
Half year ended Quarter ended
30 June 30 June 30 June 31 March 30 June
2015 2014 2015 2015 2014
£m £m £m £m £m
Interest receivable 6,107 6,544 3,031 3,076 3,279
Interest payable (1,689) (2,038) (816) (873) (980)
Net interest income 4,418 4,506 2,215 2,203 2,299
Fees and commissions receivable 1,958 2,243 969 989 1,126
Fees and commissions payable (363) (475) (186) (177) (244)
Income from trading activities 875 1,450 545 330 528
Gain on redemption of own debt - 20 - - -
Other operating income 368 805 194 174 154
Non-interest income 2,838 4,043 1,522 1,316 1,564
Total income 7,256 8,549 3,737 3,519 3,863
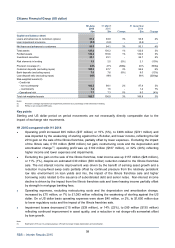
Staff costs (2,855) (2,997) (1,530) (1,325) (1,558)
Premises and equipment (745) (1,126) (326) (419) (546)
Other administrative expenses (2,366) (1,357) (1,027) (1,339) (780)
Depreciation and amortisation (712) (466) (200) (512) (237)
Write down of goodwill and other intangible assets (606) (212) (606) - (130)
Operating expenses (7,284) (6,158) (3,689) (3,595) (3,251)
(Loss)/profit before impairment losses (28) 2,391 48 (76) 612
Impairment releases/(losses) 321 (165) 192 129 124
Operating profit before tax 293 2,226 240 53 736
Tax charge (293) (592) (100) (193) (278)
Profit/(loss) from continuing operations - 1,634 140 (140) 458
Profit/(loss) from discontinued operations, net of tax
- Citizens (2) 354 285 674 (320) 181
- Other 4 35 - 4 26
Profit/(loss) from discontinued operations,
net of tax 358 320 674 (316) 207
Profit/(loss) for the period 358 1,954 814 (456) 665
Non-controlling interests (344) (42) (428) 84 (23)
Preference shares (143) (140) (73) (70) (75)
Other dividends (24) (27) (20) (4) (17)
Dividend access share - (320) - - (320)
(Loss)/profit attributable to ordinary and
B shareholders (153) 1,425 293 (446) 230
(Loss)/earnings per ordinary and equivalent
B share (EPS) (3)
Basic EPS from continuing and discontinued operations (1.3p) 12.6p 2.5p (3.9p) 2.0p
Basic EPS from continuing operations (1.9p) 9.9p 0.2p (2.1p) 0.3p
Notes:
(1) A reconciliation between the statutory income statement above and the non-statutory income statement on page 11 is given in Appendix 2 to this announcement.
(2) Included within Citizens discontinued operations are the results of the reportable operating segment Citizens Financial Group (CFG), the fair value remeasurement of the
loss on transfer to disposal groups, and certain Citizens related activities in Central items and related one-off and other items.
(3) Diluted EPS for continuing and discontinued operations for the half year ended 30 June 2014 was 0.1p lower than basic EPS. There was no dilutive impact in any othe
r
period.