RBS 2014 Annual Report Download - page 160
Download and view the complete annual report
Please find page 160 of the 2014 RBS annual report below. You can navigate through the pages in the report by either clicking on the pages listed below, or by using the keyword search tool below to find specific information within the annual report.-
 1
1 -
2
-
3
-
4
-
5
-
6
-
7
-
8
-
9
-
10
-
11
-
12
-
13
-
14
-
15
-
16
-
17
-
18
-
19
-
20
-
21
-
22
-
23
-
24
-
25
-
26
-
27
-
28
-
29
-
30
-
31
-
32
-
33
-
34
-
35
-
36
-
37
-
38
-
39
-
40
-
41
-
42
-
43
-
44
-
45
-
46
-
47
-
48
-
49
-
50
-
51
-
52
-
53
-
54
-
55
-
56
-
57
-
58
-
59
-
60
-
61
-
62
-
63
-
64
-
65
-
66
-
67
-
68
-
69
-
70
-
71
-
72
-
73
-
74
-
75
-
76
-
77
-
78
-
79
-
80
-
81
-
82
-
83
-
84
-
85
-
86
-
87
-
88
-
89
-
90
-
91
-
92
-
93
-
94
-
95
-
96
-
97
-
98
-
99
-
100
-
101
-
102
-
103
-
104
-
105
-
106
-
107
-
108
-
109
-
110
-
111
-
112
-
113
-
114
-
115
-
116
-
117
-
118
-
119
-
120
-
121
-
122
-
123
-
124
-
125
-
126
-
127
-
128
-
129
-
130
-
131
-
132
-
133
-
134
-
135
-
136
-
137
-
138
-
139
-
140
-
141
-
142
-
143
-
144
-
145
-
146
-
147
-
148
-
149
-
 150
150 -
 151
151 -
 152
152 -
 153
153 -
 154
154 -
 155
155 -
 156
156 -
 157
157 -
 158
158 -
 159
159 -
 160
160 -
 161
161 -
 162
162 -
 163
163 -
 164
164 -
 165
165 -
 166
166 -
 167
167 -
 168
168 -
 169
169 -
 170
170 -
171
-
172
-
173
-
174
-
175
-
176
-
177
-
178
-
179
-
180
-
181
-
182
-
183
-
184
-
185
-
186
-
187
-
188
-
189
-
190
-
191
-
192
-
193
-
194
-
195
-
196
-
197
-
198
-
199
 |
 |

25
RBS – Interim Results 2015
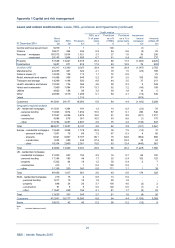
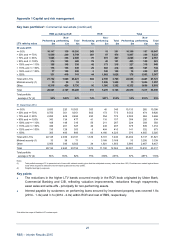
Appendix 1 Capital and risk management
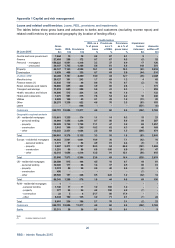
Key loan portfolios*
The internal measure used for credit risk management is credit risk assets (CRA) and consists of lending,
derivatives after the effect of enforceable netting arrangements and contingent obligations.
The table below summarises CRA by sector and geographic region.
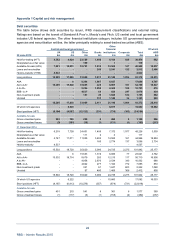
Wholesale
Banks and Natural Retail and Of which:
Personal other FIs Sovereign Property resources leisure Othe
r
Total RCR
30 June 2015 £m £m £m £m £m £m £m £m £m
UK 130,302 25,382 50,922 39,438 8,099 14,618 40,062 308,823 7,168
Western Europe (excl. UK) 15,113 33,644 11,025 7,523 3,232 2,418 11,485 84,440 6,241
North America 33,113 12,779 22,465 7,308 5,057 5,945 19,892 106,559 556
RoW (1) 3,383 9,916 3,599 1,511 3,703 597 11,933 34,642 2,936
Total 181,911 81,721 88,011 55,780 20,091 23,578 83,372 534,464 16,901
of which: RCR 90 2,621 30 7,458 2,746 796 3,160 16,901 n/a
Flow into forbearance (2) 1,625 88 - 1,934 412 454 902 5,415 1,420
of which: RCR - 11 - 1,060 36 145 168 1,420 n/a
A
Q10 7,477 715 1 8,003 258 1,278 2,397 20,129 7,662
of which: RCR 75 304 - 5,540 150 483 1,110 7,662 n/a
31 December 2014
UK 129,091 27,560 45,308 44,401 7,825 15,539 40,199 309,923 11,579
Western Europe (excl. UK) 16,802 37,156 6,855 11,858 4,030 3,221 13,162 93,084 12,159
North America 32,449 13,367 27,162 6,846 7,070 5,736 21,642 114,272 851
RoW (1) 2,406 13,406 3,039 1,875 5,685 1,188 17,187 44,786 5,061
Total 180,748 91,489 82,364 64,980 24,610 25,684 92,190 562,065 29,650
of which: RCR 203 3,587 536 14,819 2,910 1,828 5,767 29,650 n/a
Flow into forbearance (2) 4,350 60 - 5,416 377 984 1,956 13,143 4,839
of which: RCR - 29 - 3,551 28 535 696 4,839 n/a
A
Q10 8,424 638 1 14,743 263 2,329 3,662 30,060 16,099
of which: RCR 182 423 - 11,886 112 1,355 2,141 16,099 n/a
Notes:
(1) Rest of World comprises Asia Pacific, Central and Eastern Europe, the Middle East, Central Asia and Africa, and supranationals such as the World Bank.
(2) Completed during the period.
Key points
• The CRA decrease reflected a continued focus on risk reduction and improving overall credit quality.
• CRA decreased in all regions and sectors except sovereign where CRA increased by 7%, reflecting
Treasury activity. UK CRA (excluding RCR) increased by 1%, in personal (mainly mortgage lending).
• For wholesale loans, the flow into forbearance decreased during H1 2015 compared with H2 2014 in
line with improving market conditions and RCR’s disposal strategy. Of the total forbearance granted,
54% related to non-performing loans with a provision coverage of 48% (2014 - 62%).
• The property sector remained the most significant contributor to the forborne portfolio. There was an
increase in forbearance granted in the natural resources sector driven by counterparties in the oil and
gas sector (refer to page 28 for further sector information).
• RCR is on track to complete its targeted run-down by the end of 2015, with CRA down by 43% to
£16.9 billion. Non-performing exposures decreased significantly to £7.7 billion (2014 - £16.1 billion)
driven by the disposal strategy and the improving economic climate.
*Not within the scope of Deloitte LLP’s review report