RBS 2014 Annual Report Download - page 194
Download and view the complete annual report
Please find page 194 of the 2014 RBS annual report below. You can navigate through the pages in the report by either clicking on the pages listed below, or by using the keyword search tool below to find specific information within the annual report.-
 1
1 -
2
-
3
-
4
-
5
-
6
-
7
-
8
-
9
-
10
-
11
-
12
-
13
-
14
-
15
-
16
-
17
-
18
-
19
-
20
-
21
-
22
-
23
-
24
-
25
-
26
-
27
-
28
-
29
-
30
-
31
-
32
-
33
-
34
-
35
-
36
-
37
-
38
-
39
-
40
-
41
-
42
-
43
-
44
-
45
-
46
-
47
-
48
-
49
-
50
-
51
-
52
-
53
-
54
-
55
-
56
-
57
-
58
-
59
-
60
-
61
-
62
-
63
-
64
-
65
-
66
-
67
-
68
-
69
-
70
-
71
-
72
-
73
-
74
-
75
-
76
-
77
-
78
-
79
-
80
-
81
-
82
-
83
-
84
-
85
-
86
-
87
-
88
-
89
-
90
-
91
-
92
-
93
-
94
-
95
-
96
-
97
-
98
-
99
-
100
-
101
-
102
-
103
-
104
-
105
-
106
-
107
-
108
-
109
-
110
-
111
-
112
-
113
-
114
-
115
-
116
-
117
-
118
-
119
-
120
-
121
-
122
-
123
-
124
-
125
-
126
-
127
-
128
-
129
-
130
-
131
-
132
-
133
-
134
-
135
-
136
-
137
-
138
-
139
-
140
-
141
-
142
-
143
-
144
-
145
-
146
-
147
-
148
-
149
-
150
-
151
-
152
-
153
-
154
-
155
-
156
-
157
-
158
-
159
-
160
-
161
-
162
-
163
-
164
-
165
-
166
-
167
-
168
-
169
-
170
-
171
-
172
-
173
-
174
-
175
-
176
-
177
-
178
-
179
-
180
-
181
-
182
-
183
-
 184
184 -
 185
185 -
 186
186 -
 187
187 -
 188
188 -
 189
189 -
 190
190 -
 191
191 -
 192
192 -
 193
193 -
 194
194 -
 195
195 -
 196
196 -
 197
197 -
 198
198 -
 199
199
 |
 |
1
RBS – Interim Results 2015
Appendix 4 Williams & Glyn
In accordance with a commitment to the European Commission, RBS agreed to dispose of its Williams &
Glyn business (RBS England and Wales and NatWest Scotland branch-based businesses, along with certain
SME and corporate activities across the UK).
RBS is creating a standalone banking entity supported by a bespoke technology solution to facilitate the
disposal of its Williams & Glyn business through an Initial Public Offering (IPO). Following the conclusion of
a £600 million pre-IPO investment from a consortium of investors led by global financial services specialists
Corsair Capital and Centerbridge Partners, and including the Church Commissioners for England and RIT
Capital Partners plc, the Williams & Glyn business continues to make progress towards its IPO.
The pre-IPO investment took the form of a £600 million bond issued by RBS. This will be exchangeable for
a significant non-controlling interest in Williams & Glyn at the time of its IPO. The bond will convert into
Williams & Glyn shares at the IPO price, subject to a minimum ownership level which will be linked to the
tangible book value of Williams & Glyn prior to the IPO, and in any case no more than a stake of 49%. To the
extent the maximum ownership level is reached, the bond will be partially redeemed in cash such that the
consortium of investors will receive a total value of £600 million of cash and shares at the IPO price. At the
IPO, subject to RBS’s consent, the Investors will have the option to acquire up to 10% additionally at the IPO
price, subject to their pro forma ownership being no more than 49% in aggregate.
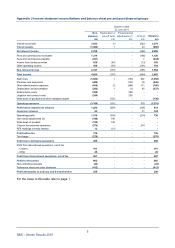
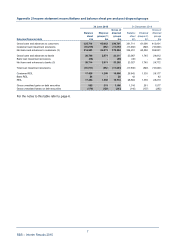
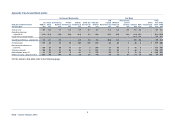
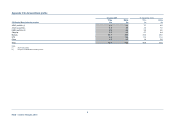
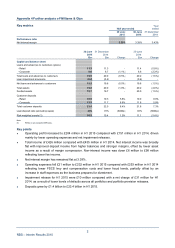
Set out below are the income statement and key balance sheet metrics in respect of the Williams & Glyn
business. This represents the financial performance of Williams & Glyn prepared on a carve out internally
managed basis illustrating a current view of the business. During the periods presented, Williams & Glyn has
been an integral part of RBS and has not operated as a separate legal entity. These figures do not
necessarily reflect the cost base, funding and capital profile of a standalone bank.
Half year ended Year ended
30 June 30 June 31 Decembe
r
2015 2014 2014
£m £m £m
Income statement
Net interest income 328 331 668
Non-interest income 98 104 210
Total income 426 435 878
Operating expenses (1) (232) (253) (512)
Profit before impairment losses 194 182 366
Impairment releases/(losses) 10 (31) (54)
Operating profit (2) 204 151 312
Analysis of income by business
Retail 237 249 503
Corporate 189 186 375
Total income 426 435 878
Analysis of impairments by business
Retail 12 26 47
Corporate (22) 5 7
Total impairment (releases)/losses (10) 31 54
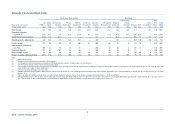
Loan impairment charge as % of gross customer loans and advances (excluding
reverse repurchase agreements) by business
Retail 0.21% 0.46% 0.42%
Corporate (0.51%) 0.11% 0.08%
Total (0.10%) 0.31% 0.27%
Notes:
(1) Does not reflect the cost base, funding and capital profile of a standalone bank. Operating expenses include charges based on an attribution of support provided by RBS
to W&G. Expenses incurred by W&G were: H1 2014 - £173 million; FY 2014 - £352 million; H1 2015 - £171 million.
(2) Operating profit includes; £7 million profit in Commercial Banking (H1 2014 - £8 million profit; FY 2014 - £14 million profit); £1 million profit in RCR (H1 2014 - £1 million
profit; FY 2014 - £3 million profit); £60 million loss in Central items (H1 2014 - £81 million loss; FY 2014 - £160 million loss); the remainder of W&G is reported in UK PBB.