RBS 2014 Annual Report Download - page 99
Download and view the complete annual report
Please find page 99 of the 2014 RBS annual report below. You can navigate through the pages in the report by either clicking on the pages listed below, or by using the keyword search tool below to find specific information within the annual report.-
 1
1 -
2
-
3
-
4
-
5
-
6
-
7
-
8
-
9
-
10
-
11
-
12
-
13
-
14
-
15
-
16
-
17
-
18
-
19
-
20
-
21
-
22
-
23
-
24
-
25
-
26
-
27
-
28
-
29
-
30
-
31
-
32
-
33
-
34
-
35
-
36
-
37
-
38
-
39
-
40
-
41
-
42
-
43
-
44
-
45
-
46
-
47
-
48
-
49
-
50
-
51
-
52
-
53
-
54
-
55
-
56
-
57
-
58
-
59
-
60
-
61
-
62
-
63
-
64
-
65
-
66
-
67
-
68
-
69
-
70
-
71
-
72
-
73
-
74
-
75
-
76
-
77
-
78
-
79
-
80
-
81
-
82
-
83
-
84
-
85
-
86
-
87
-
88
-
 89
89 -
 90
90 -
 91
91 -
 92
92 -
 93
93 -
 94
94 -
 95
95 -
 96
96 -
 97
97 -
 98
98 -
 99
99 -
 100
100 -
 101
101 -
 102
102 -
 103
103 -
 104
104 -
 105
105 -
 106
106 -
 107
107 -
 108
108 -
 109
109 -
110
-
111
-
112
-
113
-
114
-
115
-
116
-
117
-
118
-
119
-
120
-
121
-
122
-
123
-
124
-
125
-
126
-
127
-
128
-
129
-
130
-
131
-
132
-
133
-
134
-
135
-
136
-
137
-
138
-
139
-
140
-
141
-
142
-
143
-
144
-
145
-
146
-
147
-
148
-
149
-
150
-
151
-
152
-
153
-
154
-
155
-
156
-
157
-
158
-
159
-
160
-
161
-
162
-
163
-
164
-
165
-
166
-
167
-
168
-
169
-
170
-
171
-
172
-
173
-
174
-
175
-
176
-
177
-
178
-
179
-
180
-
181
-
182
-
183
-
184
-
185
-
186
-
187
-
188
-
189
-
190
-
191
-
192
-
193
-
194
-
195
-
196
-
197
-
198
-
199
 |
 |

97
RBS – Interim Results 2015
Notes
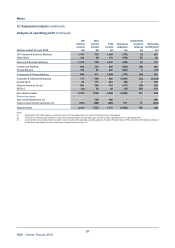
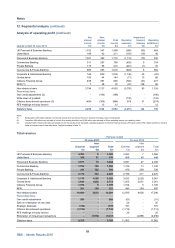
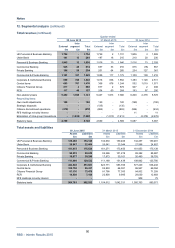
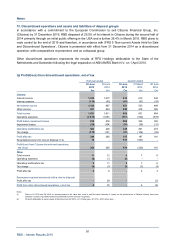
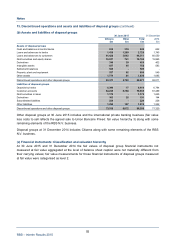
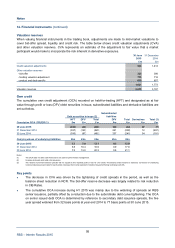
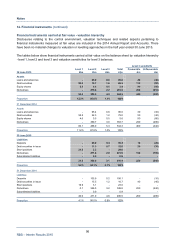
14. Financial instruments (continued)
Notes:
(1) Level 1: valued using unadjusted quoted prices in active markets, for identical financial instruments. Examples include G10 government securities, listed equity shares,
certain exchange-traded derivatives and certain US agency securities.
Level 2: valued using techniques based significantly on observable market data. Instruments in this category are valued using:
(a) quoted prices for similar instruments or identical instruments in markets which are not considered to be active; or
(b) valuation techniques where all the inputs that have a significant effect on the valuations are directly or indirectly based on observable market data.
Level 2 instruments included non-G10 government securities, most government agency securities, investment-grade corporate bonds, certain mortgage products,
including CLOs, most bank loans, repos and reverse repos, less liquid listed equities, state and municipal obligations, most notes issued, and certain money marke
t
securities and loan commitments and most OTC derivatives.
Level 3: instruments in this category have been valued using a valuation technique where at least one input which could have a significant effect on the instrument’s
valuation, is not based on observable market data. Level 3 instruments primarily include cash instruments which trade infrequently, certain syndicated and commercial
mortgage loans, certain emerging markets instruments, unlisted equity shares, certain residual interests in securitisations, CDOs, other mortgage-backed products and
less liquid debt securities, certain structured debt securities in issue, and OTC derivatives where valuation depends upon unobservable inputs such as certain credit and
exotic derivatives. No gain or loss is recognised on the initial recognition of a financial instrument valued using a technique incorporating significant unobservable data.
(2) Transfers between levels are deemed to have occurred at the beginning of the quarter in which the instruments were transferred. There were no significant transfers
between level 1 and level 2.
(3) For an analysis of derivatives by type of contract refer to Appendix 1 - Capital and risk management - Credit risk – Derivatives.
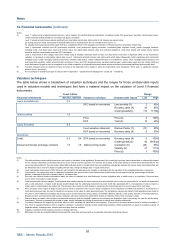
Valuation techniques
The table below shows a breakdown of valuation techniques and the ranges for those unobservable inputs
used in valuation models and techniques that have a material impact on the valuation of Level 3 financial
instruments.
Level 3 (£bn) Range
Financial instruments Assets Liabilities Valuation technique Unobservable inputs Low High
Loans and advances 0.6
DFC based on recoveries Loss severity (3) 280%
Recovery rates (4) 26 85%
Credit spreads(5) 110 1115bp
Debt securities 1.6
Price Price (6) 0129%
DCF Yield (6) 10 30%
Equity Securities 0.5
Fund valuation statement Discount factor (7) (10) 35%
DCF based on recoveries Recovery rates (4) 030%
Derivatives
Credit 0.3 0.4 DCF based on recoveries Recovery rates (4) 0100%
Credit spreads (5) 42 1010bps
Interest and foreign exchange contracts 1.9 1.6 Option pricing model Correlation (8) (46) 95%
Volatility (9) 21 111%
Price (6) 1100%
Notes:
(1) The table excludes unobservable inputs where the impact on valuation is less significant. Movements in the underlying input may have a favourable or unfavourable impac
t
on the valuation depending on the particular terms of the contract and the exposure. For example, an increase in the credit spread of a bond would be favourable for the
issuer and unfavourable for the note holder. Whilst RBS indicates where it considers that there are significant relationships between the inputs, these inter-relationships will
be affected by macro economic factors including interest rates, foreign exchange rates or equity index levels.
(2) Level 3 structured notes issued of £0.7 billion are not included in the table above as valuation is consistent with the valuation of the embedded derivative component.
(3) Loss severity : the loss severity rate of a defaulted instrument is the present value of its lifetime losses (both interest and principal losses) as a percentage of principal
balance, measured at either the origination date or the default date
(4) Recovery rate: Reflects market expectations about the return of principal for a debt instrument or other obligations after a credit event or on liquidation. Recovery rates
tend to move conversely to credit spreads.
(5) Credit spreads and discount margins: Credit spreads and margins express the return required over a benchmark rate or index to compensate for the credit risk associated
with a cash instrument. A higher credit spread would indicate that the underlying instrument has more credit risk associated with it. Consequently, investors require a
higher yield to compensate for the higher risk. The discount rate comprises credit spread or margin plus the benchmark rate; it is used to value future cash flows
(6) Price and yield: There may be a range of prices used to value an instrument that may be a direct comparison of one instrument or portfolio with another or, movements in a
more liquid instrument may be used to indicate the movement in the value of a less liquid instrument. The comparison may also be indirect in that adjustments are made to
the price to reflect differences between the pricing source and the instrument being valued, for example different maturity, credit quality, seniority or expected pay-outs.
Similarly to price, an instrument’s yield may be compared with other instruments’ yields either directly or indirectly. Prices move inversely to yields
(7) Discount factor: as used in risk and return models which presume that the marginal investors in the company are diversified. Such is not usually the case for private equity
investments. This risk is measured with a beta or betas, usually estimated by looking at past prices or returns from valuation statements.
(8) Correlation: Measures the degree by which two prices or other variables are observed to move together. If they move in the same direction there is positive correlation; i
f
they move in opposite directions there is negative correlation. Correlations typically include relationships between: default probabilities of assets in a basket (a group o
f
separate assets), exchange rates, interest rates and other financial variables.
(9) Volatility: A measure of the tendency of a price to change with time.
(10) RBS does not have any material liabilities measured at fair value that are issued with an inseparable third party credit enhancement.