RBS 2014 Annual Report Download - page 38
Download and view the complete annual report
Please find page 38 of the 2014 RBS annual report below. You can navigate through the pages in the report by either clicking on the pages listed below, or by using the keyword search tool below to find specific information within the annual report.-
 1
1 -
2
-
3
-
4
-
5
-
6
-
7
-
8
-
9
-
10
-
11
-
12
-
13
-
14
-
15
-
16
-
17
-
18
-
19
-
20
-
21
-
22
-
23
-
24
-
25
-
26
-
27
-
 28
28 -
 29
29 -
 30
30 -
 31
31 -
 32
32 -
 33
33 -
 34
34 -
 35
35 -
 36
36 -
 37
37 -
 38
38 -
 39
39 -
 40
40 -
 41
41 -
 42
42 -
 43
43 -
 44
44 -
 45
45 -
 46
46 -
 47
47 -
 48
48 -
49
-
50
-
51
-
52
-
53
-
54
-
55
-
56
-
57
-
58
-
59
-
60
-
61
-
62
-
63
-
64
-
65
-
66
-
67
-
68
-
69
-
70
-
71
-
72
-
73
-
74
-
75
-
76
-
77
-
78
-
79
-
80
-
81
-
82
-
83
-
84
-
85
-
86
-
87
-
88
-
89
-
90
-
91
-
92
-
93
-
94
-
95
-
96
-
97
-
98
-
99
-
100
-
101
-
102
-
103
-
104
-
105
-
106
-
107
-
108
-
109
-
110
-
111
-
112
-
113
-
114
-
115
-
116
-
117
-
118
-
119
-
120
-
121
-
122
-
123
-
124
-
125
-
126
-
127
-
128
-
129
-
130
-
131
-
132
-
133
-
134
-
135
-
136
-
137
-
138
-
139
-
140
-
141
-
142
-
143
-
144
-
145
-
146
-
147
-
148
-
149
-
150
-
151
-
152
-
153
-
154
-
155
-
156
-
157
-
158
-
159
-
160
-
161
-
162
-
163
-
164
-
165
-
166
-
167
-
168
-
169
-
170
-
171
-
172
-
173
-
174
-
175
-
176
-
177
-
178
-
179
-
180
-
181
-
182
-
183
-
184
-
185
-
186
-
187
-
188
-
189
-
190
-
191
-
192
-
193
-
194
-
195
-
196
-
197
-
198
-
199
 |
 |
36
RBS – Interim Results 2015
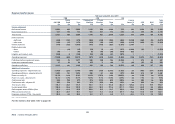
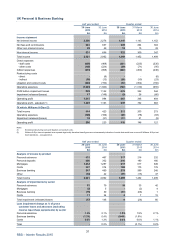
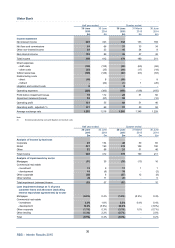
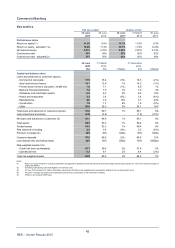
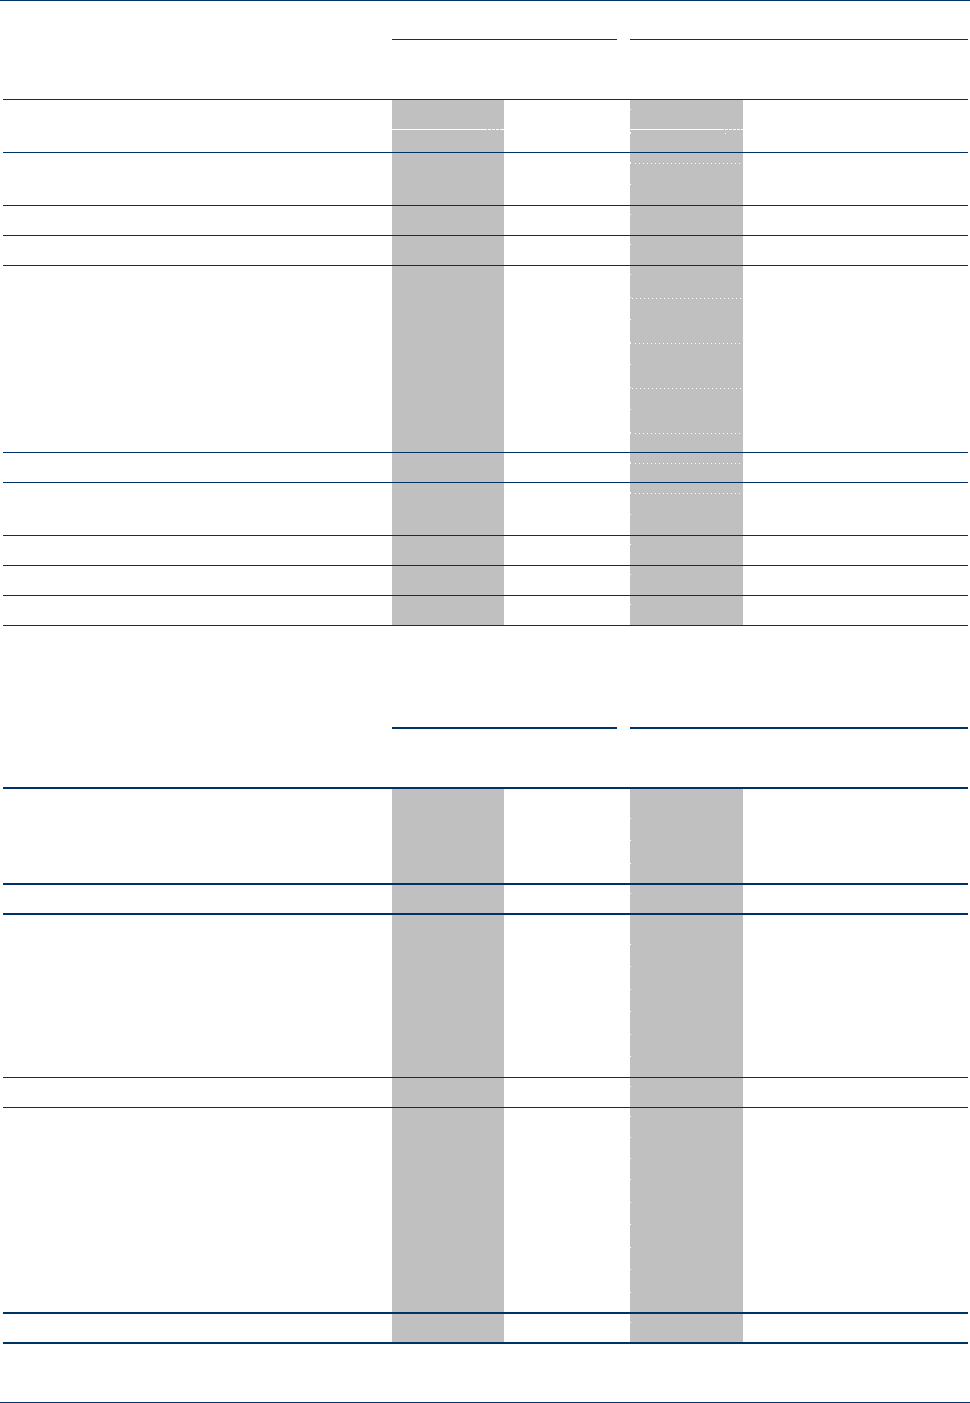
Ulster Bank
Half year ended Quarter ended
30 June 30 June 30 June 31 March 30 June
2015 2014 2015 2015 2014
£m £m £m £m £m
Income statement
Net interest income 265 323 132 133 169
Net fees and commissions 64 66 31 33 34
Other non-interest income 39 23 15 24 8
Non-interest income 103 89 46 57 42
Total income 368 412 178 190 211
Direct expenses
- staff costs (120) (125) (60) (60) (62)
- other costs (33) (35) (16) (17) (18)
Indirect expenses (126) (126) (63) (63) (63)
Restructuring costs
- direct (18) 8 (18) - 8
- indirect -(22) (1) 1 (20)
Litigation and conduct costs 8- 8 - -
Operating expenses (289) (300) (150) (139) (155)
Profit before impairment losses 79 112 28 51 56
Impairment releases/(losses) 52 (57) 52 - (10)
Operating profit 131 55 80 51 46
Operating profit - adjusted (1) 141 69 91 50 58
A
verage exchange rate 1.365 1.218 1.385 1.345 1.228
Note:
(1) Excluding restructuring costs and litigation and conduct costs.
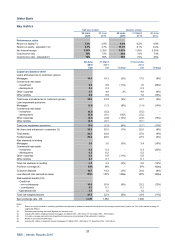
Half year ended Quarter ended
30 June 30 June 30 June 31 March 30 June
2015 2014 2015 2015 2014
£m £m £m £m £m
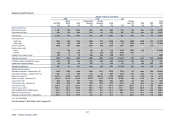
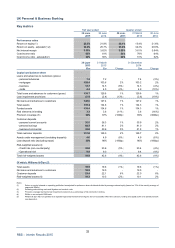
Analysis of income by business
Corporate 95 134 45 50 65
Retail 221 190 112 109 100
Other 52 88 21 31 46
Total income 368 412 178 190 211
Analysis of impairments by sector
Mortgages (51) 35 (38) (13) 16
Commercial real estate
- investment 12 9 11 1 1
- development 18 (6) 18 - (3)
Other corporate (25) 8 (37) 12 (9)
Other lending (6) 11 (6) - 5
Total impairment (releases)/losses (52) 57 (52) - 10
Loan impairment charge as % of gross
customer loans and advances (excluding
reverse repurchase agreements) by sector
Mortgages (0.6%) 0.4% (1.0%) (0.3%) 0.4%
Commercial real estate
- investment 3.0% 1.8% 5.5% 0.4% 0.4%
- development 12.0% (3.0%) 24.0% - (3.0%)
Other corporate (1.1%) 0.3% (3.1%) 1.0% (0.7%)
Other lending (1.3%) 2.2% (2.7%) - 2.0%
Total (0.5%) 0.4% (0.9%) - 0.2%