RBS 2014 Annual Report Download - page 51
Download and view the complete annual report
Please find page 51 of the 2014 RBS annual report below. You can navigate through the pages in the report by either clicking on the pages listed below, or by using the keyword search tool below to find specific information within the annual report.-
 1
1 -
2
-
3
-
4
-
5
-
6
-
7
-
8
-
9
-
10
-
11
-
12
-
13
-
14
-
15
-
16
-
17
-
18
-
19
-
20
-
21
-
22
-
23
-
24
-
25
-
26
-
27
-
28
-
29
-
30
-
31
-
32
-
33
-
34
-
35
-
36
-
37
-
38
-
39
-
40
-
 41
41 -
 42
42 -
 43
43 -
 44
44 -
 45
45 -
 46
46 -
 47
47 -
 48
48 -
 49
49 -
 50
50 -
 51
51 -
 52
52 -
 53
53 -
 54
54 -
 55
55 -
 56
56 -
 57
57 -
 58
58 -
 59
59 -
 60
60 -
 61
61 -
62
-
63
-
64
-
65
-
66
-
67
-
68
-
69
-
70
-
71
-
72
-
73
-
74
-
75
-
76
-
77
-
78
-
79
-
80
-
81
-
82
-
83
-
84
-
85
-
86
-
87
-
88
-
89
-
90
-
91
-
92
-
93
-
94
-
95
-
96
-
97
-
98
-
99
-
100
-
101
-
102
-
103
-
104
-
105
-
106
-
107
-
108
-
109
-
110
-
111
-
112
-
113
-
114
-
115
-
116
-
117
-
118
-
119
-
120
-
121
-
122
-
123
-
124
-
125
-
126
-
127
-
128
-
129
-
130
-
131
-
132
-
133
-
134
-
135
-
136
-
137
-
138
-
139
-
140
-
141
-
142
-
143
-
144
-
145
-
146
-
147
-
148
-
149
-
150
-
151
-
152
-
153
-
154
-
155
-
156
-
157
-
158
-
159
-
160
-
161
-
162
-
163
-
164
-
165
-
166
-
167
-
168
-
169
-
170
-
171
-
172
-
173
-
174
-
175
-
176
-
177
-
178
-
179
-
180
-
181
-
182
-
183
-
184
-
185
-
186
-
187
-
188
-
189
-
190
-
191
-
192
-
193
-
194
-
195
-
196
-
197
-
198
-
199
 |
 |
49
RBS – Interim Results 2015
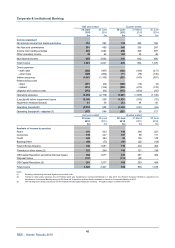
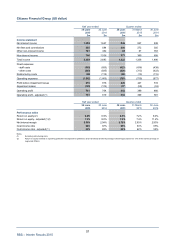
Corporate & Institutional Banking
Half year ended Quarter ended
30 June 30 June 30 June 31 March 30 June
2015 2014 2015 2015 2014
£m £m £m £m £m
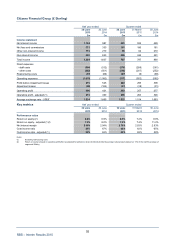
Income statement
Net interest income from banking activities 376 365 174 202 186
Net fees and commissions 395 490 160 235 247
Income from trading activities 559 1,482 250 309 597
Other operating income (6) 90 (64) 58 46
Non-interest income 948 2,062 346 602 890
Total income 1,324 2,427 520 804 1,076
Direct expenses
- staff costs (322) (487) (142) (180) (217)
- other costs (149) (250) (71) (78) (140)
Indirect expenses (1,061) (1,180) (521) (540) (587)
Restructuring costs
- direct (211) (22) (195) (16) (9)
- indirect (814) (169) (539) (275) (143)
Litigation and conduct costs (873) (50) (373) (500) (50)
Operating expenses (3,430) (2,158) (1,841) (1,589) (1,146)
(Loss)/profit before impairment losses (2,106) 269 (1,321) (785) (70)
Impairment releases/(losses) 31 39 (13) 44 45
Operating (loss)/profit (2,075) 308 (1,334) (741) (25)
Operating (loss)/profit - adjusted (1) (177) 549 (227) 50 177
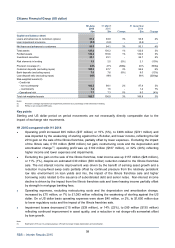
Half year ended Quarter ended
30 June 30 June 30 June 31 March 30 June
2015 2014 2015 2015 2014
£m £m £m £m £m
Analysis of income by product
Rates 372 523 164 208 221
Currencies 195 247 107 88 111
Credit 242 384 86 156 170
Banking/Other (69) (73) (47) (22) (46)
Total CIB (Go-forward) 740 1,081 310 430 456
Transfers to other areas (2) 223 269 102 121 136
CIB Capital Resolution excluding disposal losses 502 1,077 221 281 484
Disposal losses (141) - (113) (28) -
CIB Capital Resolution (3) 361 1,077 108 253 484
Total income 1,324 2,427 520 804 1,076
Notes:
(1) Excluding restructuring costs and litigation and conduct costs.
(2) Transfer to other areas comprises the UK Portfolio which was transferred to Commercial Banking on 1 May 2015, the Western European Portfolio is expected to be
transferred to Commercial Banking during H2 2015 and UK Transaction services which is expected to transfer to Commercial Banking in 2016.
(3) The CIB segment is being restructured into Go-forward and CIB Capital Resolution elements. The split is subject to further refinement.