RBS 2014 Annual Report Download - page 28
Download and view the complete annual report
Please find page 28 of the 2014 RBS annual report below. You can navigate through the pages in the report by either clicking on the pages listed below, or by using the keyword search tool below to find specific information within the annual report.-
 1
1 -
2
-
3
-
4
-
5
-
6
-
7
-
8
-
9
-
10
-
11
-
12
-
13
-
14
-
15
-
16
-
17
-
 18
18 -
 19
19 -
 20
20 -
 21
21 -
 22
22 -
 23
23 -
 24
24 -
 25
25 -
 26
26 -
 27
27 -
 28
28 -
 29
29 -
 30
30 -
 31
31 -
 32
32 -
 33
33 -
 34
34 -
 35
35 -
 36
36 -
 37
37 -
 38
38 -
39
-
40
-
41
-
42
-
43
-
44
-
45
-
46
-
47
-
48
-
49
-
50
-
51
-
52
-
53
-
54
-
55
-
56
-
57
-
58
-
59
-
60
-
61
-
62
-
63
-
64
-
65
-
66
-
67
-
68
-
69
-
70
-
71
-
72
-
73
-
74
-
75
-
76
-
77
-
78
-
79
-
80
-
81
-
82
-
83
-
84
-
85
-
86
-
87
-
88
-
89
-
90
-
91
-
92
-
93
-
94
-
95
-
96
-
97
-
98
-
99
-
100
-
101
-
102
-
103
-
104
-
105
-
106
-
107
-
108
-
109
-
110
-
111
-
112
-
113
-
114
-
115
-
116
-
117
-
118
-
119
-
120
-
121
-
122
-
123
-
124
-
125
-
126
-
127
-
128
-
129
-
130
-
131
-
132
-
133
-
134
-
135
-
136
-
137
-
138
-
139
-
140
-
141
-
142
-
143
-
144
-
145
-
146
-
147
-
148
-
149
-
150
-
151
-
152
-
153
-
154
-
155
-
156
-
157
-
158
-
159
-
160
-
161
-
162
-
163
-
164
-
165
-
166
-
167
-
168
-
169
-
170
-
171
-
172
-
173
-
174
-
175
-
176
-
177
-
178
-
179
-
180
-
181
-
182
-
183
-
184
-
185
-
186
-
187
-
188
-
189
-
190
-
191
-
192
-
193
-
194
-
195
-
196
-
197
-
198
-
199
 |
 |

26
RBS – Interim Results 2015
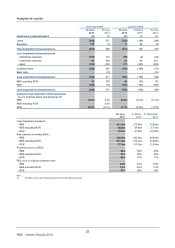
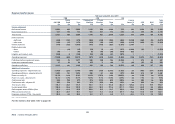
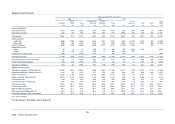
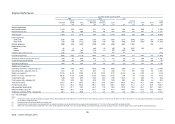
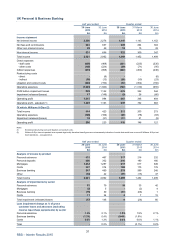
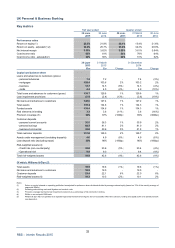
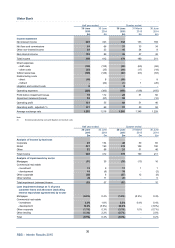
Segment performance
Half year ended 30 June 2015
PBB CPB CIB
Ulste
r
Commercial Private Central Total
UK PBB Bank Total Banking Banking Total items (1) CFG RCR RBS
£m £m £m £m £m £m £m £m £m £m £m
Income statement
Net interest income 2,290 265 2,555 1,108 254 1,362 376 150 1,104 (25) 5,522
Non-interest income 631 103 734 606 167 773 948 43 490 190 3,178
Total income 2,921 368 3,289 1,714 421 2,135 1,324 193 1,594 165 8,700
Direct expenses
- staff costs (456) (120) (576) (255) (143) (398) (322) (1,159) (564) (56) (3,075)
- other costs (140) (33) (173) (110) (26) (136) (149) (1,517) (422) (13) (2,410)
Indirect expenses (913) (126) (1,039) (433) (194) (627) (1,061) 2,759 -(32) -
Restructuring costs
- direct - (18) (18) (10) (3) (13) (211) (1,228) (33) - (1,503)
- indirect (50) - (50) (8) (80) (88) (814) 952 -- -
Litigation and conduct costs (364) 8 (356) (59) (28) (87) (873) 1 -- (1,315)
Operating expenses (1,923) (289) (2,212) (875) (474) (1,349) (3,430) (192) (1,019) (101) (8,303)
Profit/(loss) before impairment losses 998 79 1,077 839 (53) 786 (2,106) 1 575 64 397
Impairment releases/(losses) 17 52 69 (27) 3(24) 31 (48) (89) 293 232
Operating profit/(loss) 1,015 131 1,146 812 (50) 762 (2,075) (47) 486 357 629
Additional information
Operating expenses - adjusted (£m) (2) (1,509) (279) (1,788) (798) (363) (1,161) (1,532) 83 (986) (101) (5,485)
Operating profit/(loss) - adjusted (£m) (2) 1,429 141 1,570 889 61 950 (177) 228 519 357 3,447
Return on equity (3) 23.6% 8.0% 18.4% 11.6% (7.5%) 9.2% (24.6%) nm 6.8% nm (0.7%)
Return on equity - adjusted (2,3) 34.0% 8.7% 25.7% 12.8% 5.1% 11.9% (3.5%) nm 7.3% nm 9.8%
Cost:income ratio 66% 79% 67% 51% 113% 63% 259% nm 64% nm 95%
Cost:income ratio - adjusted (2) 52% 76% 54% 47% 86% 54% 116% nm 62% nm 63%
Total assets (£bn) 135.4 26.5 161.9 94.5 17.0 111.5 482.4 105.2 87.2 16.5 964.7
Funded assets (£bn) 135.4 26.4 161.8 94.5 16.9 111.4 211.1 102.9 86.8 8.4 682.4
Risk-weighted assets (RWAs) (£bn) 41.0 21.2 62.2 66.9 9.8 76.7 88.0 15.3 69.8 14.4 326.4
RWA equivalent (£bn) (4) 44.6 20.7 65.3 72.0 9.8 81.8 89.7 15.4 70.0 17.9 340.1
Employee numbers (FTEs - thousands) 25.4 4.2 29.6 6.2 2.7 8.9 3.1 49.5 17.6 0.5 109.2
nm = not meaningful
For the notes to this table refer to page 30.