RBS 2014 Annual Report Download - page 157
Download and view the complete annual report
Please find page 157 of the 2014 RBS annual report below. You can navigate through the pages in the report by either clicking on the pages listed below, or by using the keyword search tool below to find specific information within the annual report.-
 1
1 -
2
-
3
-
4
-
5
-
6
-
7
-
8
-
9
-
10
-
11
-
12
-
13
-
14
-
15
-
16
-
17
-
18
-
19
-
20
-
21
-
22
-
23
-
24
-
25
-
26
-
27
-
28
-
29
-
30
-
31
-
32
-
33
-
34
-
35
-
36
-
37
-
38
-
39
-
40
-
41
-
42
-
43
-
44
-
45
-
46
-
47
-
48
-
49
-
50
-
51
-
52
-
53
-
54
-
55
-
56
-
57
-
58
-
59
-
60
-
61
-
62
-
63
-
64
-
65
-
66
-
67
-
68
-
69
-
70
-
71
-
72
-
73
-
74
-
75
-
76
-
77
-
78
-
79
-
80
-
81
-
82
-
83
-
84
-
85
-
86
-
87
-
88
-
89
-
90
-
91
-
92
-
93
-
94
-
95
-
96
-
97
-
98
-
99
-
100
-
101
-
102
-
103
-
104
-
105
-
106
-
107
-
108
-
109
-
110
-
111
-
112
-
113
-
114
-
115
-
116
-
117
-
118
-
119
-
120
-
121
-
122
-
123
-
124
-
125
-
126
-
127
-
128
-
129
-
130
-
131
-
132
-
133
-
134
-
135
-
136
-
137
-
138
-
139
-
140
-
141
-
142
-
143
-
144
-
145
-
146
-
 147
147 -
 148
148 -
 149
149 -
 150
150 -
 151
151 -
 152
152 -
 153
153 -
 154
154 -
 155
155 -
 156
156 -
 157
157 -
 158
158 -
 159
159 -
 160
160 -
 161
161 -
 162
162 -
 163
163 -
 164
164 -
 165
165 -
 166
166 -
 167
167 -
168
-
169
-
170
-
171
-
172
-
173
-
174
-
175
-
176
-
177
-
178
-
179
-
180
-
181
-
182
-
183
-
184
-
185
-
186
-
187
-
188
-
189
-
190
-
191
-
192
-
193
-
194
-
195
-
196
-
197
-
198
-
199
 |
 |

22
RBS – Interim Results 2015
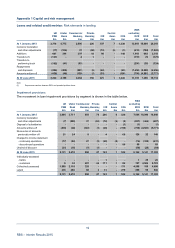
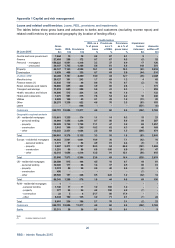
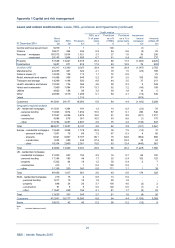
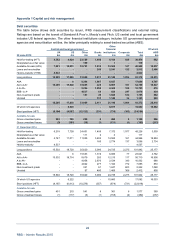
Appendix 1 Capital and risk management
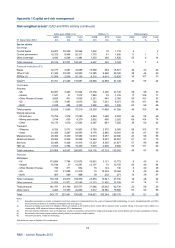
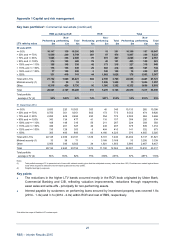
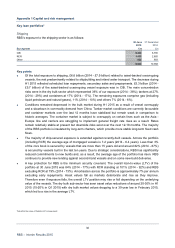
Debt securities
The table below shows debt securities by issuer, IFRS measurement classifications and external rating.
Ratings are based on the lowest of Standard & Poor’s, Moody’s and Fitch. US central and local government
includes US federal agencies. The other financial institutions category includes US government-sponsored
agencies and securitisation entities, the latter principally relating to asset-backed securities (ABS).
Othe
r
Central and local government Central and local government Central and local government financial Of which
UK US Othe
r
Banks institutions Corporate Total
A
BS
30 June 2015 £m £m £m £m £m £m £m £m
Held-for-trading (HFT) 4,352 4,624 23,129 1,446 5,100 825 39,476 982
Designated as at fair value - - 109 - 1 - 110 -
A
vailable-for-sale (AFS) 7,021 12,631 10,721 1,916 13,506 147 45,942 18,937
Loans and receivables - - - 249 2,541 122 2,912 2,496
Held-to-maturity (HTM) 4,932 - - - - - 4,932 -
Long positions 16,305 17,255 33,959 3,611 21,148 1,094 93,372 22,415
A
AA - 6 9,366 1,867 5,827 - 17,066 4,707
A
A to AA+ 16,305 17,249 10,695 422 9,997 101 54,769 15,037
A
to AA- - - 9,204 1,058 2,303 198 12,763 476
BBB- to A- - - 4,537 64 828 247 5,676 434
Non-investment grade - - 157 49 1,045 514 1,765 862
Unrated - - - 151 1,148 34 1,333 899
16,305 17,255 33,959 3,611 21,148 1,094 93,372 22,415
Of which US agencies - 6,945 - - 8,077 - 15,022 14,202
Short positions (HFT) (6,104) (4,897) (12,123) (531) (736) (163) (24,554) -
A
vailable-for-sale
Gross unrealised gains 353 185 290 6 266 6 1,106 286
Gross unrealised losses (9) (151) (10) (1) (131) (1) (303) (213)
31 December 2014
Held-for-trading 6,218 7,709 24,451 1,499 7,372 1,977 49,226 3,559
Designated as at fair value - - 111 2 4 - 117 -
A
vailable-for-sale 4,747 11,011 11,058 3,404 14,585 161 44,966 18,884
Loans and receivables - - - 185 2,774 137 3,096 2,734
Held-to-maturity 4,537 - - - - - 4,537 -
Long positions 15,502 18,720 35,620 5,090 24,735 2,275 101,942 25,177
A
AA - 6 15,533 1,319 6,086 77 23,021 4,762
A
A to AA+ 15,502 18,714 9,879 283 12,215 117 56,710 16,956
A
to AA- - - 4,958 2,670 2,534 340 10,502 688
BBB- to A- - - 4,822 277 1,184 772 7,055 853
Non-investment grade - - 331 61 1,247 603 2,242 1,060
Unrated - - 97 480 1,469 366 2,412 858
15,502 18,720 35,620 5,090 24,735 2,275 101,942 25,177
Of which US agencies - 6,222 - - 10,860 - 17,082 16,053
Short positions (HFT) (4,167) (6,413) (10,276) (557) (674) (731) (22,818) -
A
vailable-for-sale
Gross unrealised gains 451 210 541 8 361 6 1,577 389
Gross unrealised losses (1) (117) (3) (1) (158) (2) (282) (257)