RBS 2014 Annual Report Download - page 172
Download and view the complete annual report
Please find page 172 of the 2014 RBS annual report below. You can navigate through the pages in the report by either clicking on the pages listed below, or by using the keyword search tool below to find specific information within the annual report.-
 1
1 -
2
-
3
-
4
-
5
-
6
-
7
-
8
-
9
-
10
-
11
-
12
-
13
-
14
-
15
-
16
-
17
-
18
-
19
-
20
-
21
-
22
-
23
-
24
-
25
-
26
-
27
-
28
-
29
-
30
-
31
-
32
-
33
-
34
-
35
-
36
-
37
-
38
-
39
-
40
-
41
-
42
-
43
-
44
-
45
-
46
-
47
-
48
-
49
-
50
-
51
-
52
-
53
-
54
-
55
-
56
-
57
-
58
-
59
-
60
-
61
-
62
-
63
-
64
-
65
-
66
-
67
-
68
-
69
-
70
-
71
-
72
-
73
-
74
-
75
-
76
-
77
-
78
-
79
-
80
-
81
-
82
-
83
-
84
-
85
-
86
-
87
-
88
-
89
-
90
-
91
-
92
-
93
-
94
-
95
-
96
-
97
-
98
-
99
-
100
-
101
-
102
-
103
-
104
-
105
-
106
-
107
-
108
-
109
-
110
-
111
-
112
-
113
-
114
-
115
-
116
-
117
-
118
-
119
-
120
-
121
-
122
-
123
-
124
-
125
-
126
-
127
-
128
-
129
-
130
-
131
-
132
-
133
-
134
-
135
-
136
-
137
-
138
-
139
-
140
-
141
-
142
-
143
-
144
-
145
-
146
-
147
-
148
-
149
-
150
-
151
-
152
-
153
-
154
-
155
-
156
-
157
-
158
-
159
-
160
-
161
-
 162
162 -
 163
163 -
 164
164 -
 165
165 -
 166
166 -
 167
167 -
 168
168 -
 169
169 -
 170
170 -
 171
171 -
 172
172 -
 173
173 -
 174
174 -
 175
175 -
 176
176 -
 177
177 -
 178
178 -
 179
179 -
 180
180 -
 181
181 -
 182
182 -
183
-
184
-
185
-
186
-
187
-
188
-
189
-
190
-
191
-
192
-
193
-
194
-
195
-
196
-
197
-
198
-
199
 |
 |

37
RBS – Interim Results 2015
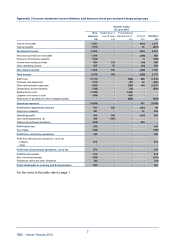
Appendix 1 Capital and risk management
Non-trading portfolios (continued)
Sensitivity of net interest income*
Earnings sensitivity to rate movements is derived from a central forecast over a 12 month period. Market
implied forward rates and new business volume, mix and pricing consistent with business assumptions are
used to generate a base case earnings forecast, which is then subjected to interest rate shocks. The
variance between the central forecast and the shock gives an indication of sensitivity to interest rate
movements.
The following table shows the sensitivity of net interest income, over the next 12 months, to an immediate
upward or downward change of 100 basis points to all interest rates. The main drivers of earnings sensitivity
relate to interest rate pass-through assumptions on customer products, reinvestment rate assumptions for
maturing product and equity structural hedges and mismatches in the re-pricing dates of loans and deposits.
In addition, the table includes the impact of a gradual 400 basis point steepening (bear steepener) and a
gradual 300 basis point flattening (bull flattener) of the yield curve at tenors greater than a year.
The scenarios represent annualised interest rate stresses of a scale deemed sufficient to trigger a
modification in customer behaviour. The asymmetry in the steepening and flattening scenarios reflects the
difference in the expected behaviour of interest rates as they approach zero.
Of which
Euro Sterling US dollar Other Total CFG
30 June 2015 £m £m £m £m £m £m
+ 100 basis point shift in yield curves 7 365 135 12 519 155
– 100 basis point shift in yield curves (9) (397) (109) (30) (545) (104)
Bear steepener 377 112
Bull flattener (130) (85)
31 December 2014
+ 100 basis point shift in yield curves (28) 347 214 (17) 516 154
– 100 basis point shift in yield curves (34) (298) (87) (12) (431) (85)
Bear steepener 406 105
Bull flattener (116) (58)
Key points
• Excluding Citizens, £258 million of the benefit of the immediate 100 basis point upward change in
interest rates relates to interest rate pass-through assumptions on customer savings accounts.
• Earnings sensitivity for the downward change of 100 basis points increased from December 2014, due
to higher interest rate expectations in the market for the next 12 months.
Structural hedging*
Banks generally have the benefit of a significant pool of stable, non and low interest bearing liabilities,
principally comprising equity and money transmission accounts. These balances, known as net free funds
are usually hedged, either by investing directly in longer-term fixed rate assets or by the use of interest rate
swaps, in order to provide a consistent and predictable revenue stream.
After hedging the net interest rate exposure of the bank externally, Treasury allocates income to products or
equity in structural hedges by reference to the relevant interest rate swap curve. Over time, the hedging
programme has built up a portfolio of interest rate swaps that provide a basis for stable income attribution to
the product and equity hedges.
*Not within the scope of Deloitte LLP’s review report