RBS 2014 Annual Report Download - page 166
Download and view the complete annual report
Please find page 166 of the 2014 RBS annual report below. You can navigate through the pages in the report by either clicking on the pages listed below, or by using the keyword search tool below to find specific information within the annual report.-
 1
1 -
2
-
3
-
4
-
5
-
6
-
7
-
8
-
9
-
10
-
11
-
12
-
13
-
14
-
15
-
16
-
17
-
18
-
19
-
20
-
21
-
22
-
23
-
24
-
25
-
26
-
27
-
28
-
29
-
30
-
31
-
32
-
33
-
34
-
35
-
36
-
37
-
38
-
39
-
40
-
41
-
42
-
43
-
44
-
45
-
46
-
47
-
48
-
49
-
50
-
51
-
52
-
53
-
54
-
55
-
56
-
57
-
58
-
59
-
60
-
61
-
62
-
63
-
64
-
65
-
66
-
67
-
68
-
69
-
70
-
71
-
72
-
73
-
74
-
75
-
76
-
77
-
78
-
79
-
80
-
81
-
82
-
83
-
84
-
85
-
86
-
87
-
88
-
89
-
90
-
91
-
92
-
93
-
94
-
95
-
96
-
97
-
98
-
99
-
100
-
101
-
102
-
103
-
104
-
105
-
106
-
107
-
108
-
109
-
110
-
111
-
112
-
113
-
114
-
115
-
116
-
117
-
118
-
119
-
120
-
121
-
122
-
123
-
124
-
125
-
126
-
127
-
128
-
129
-
130
-
131
-
132
-
133
-
134
-
135
-
136
-
137
-
138
-
139
-
140
-
141
-
142
-
143
-
144
-
145
-
146
-
147
-
148
-
149
-
150
-
151
-
152
-
153
-
154
-
155
-
 156
156 -
 157
157 -
 158
158 -
 159
159 -
 160
160 -
 161
161 -
 162
162 -
 163
163 -
 164
164 -
 165
165 -
 166
166 -
 167
167 -
 168
168 -
 169
169 -
 170
170 -
 171
171 -
 172
172 -
 173
173 -
 174
174 -
 175
175 -
 176
176 -
177
-
178
-
179
-
180
-
181
-
182
-
183
-
184
-
185
-
186
-
187
-
188
-
189
-
190
-
191
-
192
-
193
-
194
-
195
-
196
-
197
-
198
-
199
 |
 |

31
RBS – Interim Results 2015
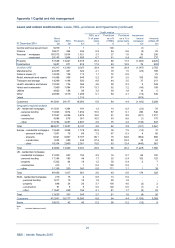
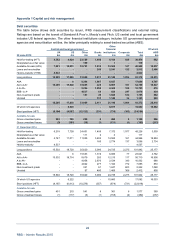
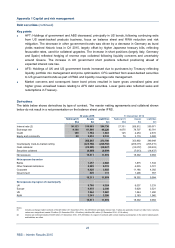
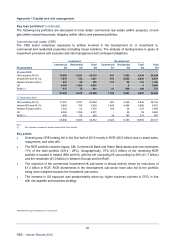
Appendix 1 Capital and risk management
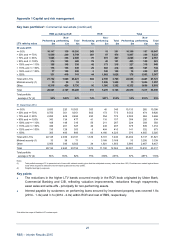
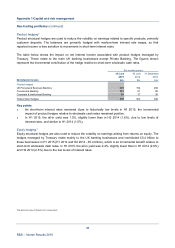
Key loan portfolios* (continued)
Personal portfolios
This section summarises personal portfolios by type, segment and related credit metrics.
Overview of personal portfolios split by product type and segment*
30 June 2015 31 December 2014
UK Ulste
r
Private Commercial UK Ulste
r
Private Commercial
PBB Bank Banking Banking (1) CFG Total PBB Bank Banking Banking (1) CFG Total
£m £m £m £m £m £m £m £m £m £m £m £m
Mortgages 105,407 15,935 6,521 2,504 20,540 150,907 103,235 17,506 6,414 2,475 21,122 150,752
Of which:
Interest only variable rate 14,397 987 3,944 823 9,138 29,289 15,165 1,238 3,952 858 9,637 30,850
Interest only fixed rate 9,683 24 1,574 36 286 11,603 9,122 25 1,520 27 292 10,986
Mixed (capital and interest only) 6,425 178 10 -987 7,600 6,820 204 - -788 7,812
Buy-to-let 12,886 1,896 403 822 140 16,147 11,602 2,091 538 850 147 15,228
Forbearance 4,465 3,557 48 42 403 8,515 4,873 3,880 51 49 409 9,262
Forbearance arrears status
- Current 3,823 2,168 47 36 330 6,404 4,158 2,231 51 40 310 6,790
- 1-3 months in arrears 330 624 1 319 977 364 689 - 334 1,090
- >3 months in arrears 312 765 - 354 1,134 351 960 - 665 1,382
Other lending 11,724 517 4,582 84 12,174 29,081 12,335 591 5,108 78 10,924 29,036
Total lending 117,131 16,452 11,103 2,588 32,714 179,988 115,570 18,097 11,522 2,553 32,046 179,788
Mortgage LTV ratios
- Total portfolio 57% 89% 53% 62% 65% 61% 57% 92% 51% 51% 67% 62%
- New business 70% 77% 45% 65% 67% 67% 71% 75% 45% 56% 68% 68%
- Performing 57% 85% 53% 60% 65% 61% 57% 88% 51% 51% 67% 61%
- Non-performing 66% 114% 76% 172% 69% 89% 67% 115% 79% 81% 73% 91%
Mortgage REIL 1,058 2,887 26 65 912 4,948 1,218 3,362 95 1946 5,622
Note:
(1) Relates to Royal Bank of Scotland International (RBSI) business.
*Not within the scope of Deloitte LLP’s review report