RBS 2014 Annual Report Download - page 25
Download and view the complete annual report
Please find page 25 of the 2014 RBS annual report below. You can navigate through the pages in the report by either clicking on the pages listed below, or by using the keyword search tool below to find specific information within the annual report.-
 1
1 -
2
-
3
-
4
-
5
-
6
-
7
-
8
-
9
-
10
-
11
-
12
-
13
-
14
-
 15
15 -
 16
16 -
 17
17 -
 18
18 -
 19
19 -
 20
20 -
 21
21 -
 22
22 -
 23
23 -
 24
24 -
 25
25 -
 26
26 -
 27
27 -
 28
28 -
 29
29 -
 30
30 -
 31
31 -
 32
32 -
 33
33 -
 34
34 -
 35
35 -
36
-
37
-
38
-
39
-
40
-
41
-
42
-
43
-
44
-
45
-
46
-
47
-
48
-
49
-
50
-
51
-
52
-
53
-
54
-
55
-
56
-
57
-
58
-
59
-
60
-
61
-
62
-
63
-
64
-
65
-
66
-
67
-
68
-
69
-
70
-
71
-
72
-
73
-
74
-
75
-
76
-
77
-
78
-
79
-
80
-
81
-
82
-
83
-
84
-
85
-
86
-
87
-
88
-
89
-
90
-
91
-
92
-
93
-
94
-
95
-
96
-
97
-
98
-
99
-
100
-
101
-
102
-
103
-
104
-
105
-
106
-
107
-
108
-
109
-
110
-
111
-
112
-
113
-
114
-
115
-
116
-
117
-
118
-
119
-
120
-
121
-
122
-
123
-
124
-
125
-
126
-
127
-
128
-
129
-
130
-
131
-
132
-
133
-
134
-
135
-
136
-
137
-
138
-
139
-
140
-
141
-
142
-
143
-
144
-
145
-
146
-
147
-
148
-
149
-
150
-
151
-
152
-
153
-
154
-
155
-
156
-
157
-
158
-
159
-
160
-
161
-
162
-
163
-
164
-
165
-
166
-
167
-
168
-
169
-
170
-
171
-
172
-
173
-
174
-
175
-
176
-
177
-
178
-
179
-
180
-
181
-
182
-
183
-
184
-
185
-
186
-
187
-
188
-
189
-
190
-
191
-
192
-
193
-
194
-
195
-
196
-
197
-
198
-
199
 |
 |

23
RBS – Interim Results 2015
Analysis of results
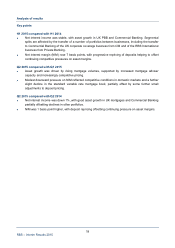
Key points
H1 2015 compared with H1 2014
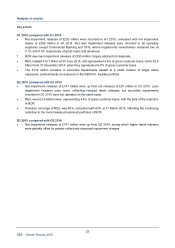
• Net impairment releases of £232 million were recorded in H1 2015, compared with net impairment
losses of £269 million in H1 2014. Net loan impairment releases were recorded in all operating
segments except Commercial Banking and CFG, where impairments nevertheless remained low a
t
0.1% and 0.3% respectively of gross loans and advances.
• RCR saw loan impairment releases of £355 million, largely arising from disposals.
• REIL totalled £18.7 billion at 30 June 2015, and represented 4.8% of gross customer loans, down £9.5
billion from 31 December 2014, when they represented 6.8% of gross customer loans.
• The £112 million increase in securities impairments related to a small number of single name
exposures, predominantly an exposure in the RBS N.V. liquidity portfolio.
Q2 2015 compared with Q1 2015
• Net impairment releases of £141 million were up from net releases of £91 million in Q1 2015. Loan
impairment releases were lower, reflecting reduced latent releases, but securities impairments
recorded in Q1 2015 were not repeated on the same scale.
• REIL were £3.6 billion lower, representing 4.8% of gross customer loans, with the bulk of the reduction
in RCR.
• Provision coverage of REIL was 60%, compared with 62% at 31 March 2015, reflecting the continuing
reduction in the more heavily provisioned portfolios of RCR.
Q2 2015 compared with Q2 2014
• Net impairment releases of £141 million were up from Q2 2014, during which higher latent releases
were partially offset by greater collectively assessed impairment charges.