RBS 2014 Annual Report Download - page 148
Download and view the complete annual report
Please find page 148 of the 2014 RBS annual report below. You can navigate through the pages in the report by either clicking on the pages listed below, or by using the keyword search tool below to find specific information within the annual report.-
 1
1 -
2
-
3
-
4
-
5
-
6
-
7
-
8
-
9
-
10
-
11
-
12
-
13
-
14
-
15
-
16
-
17
-
18
-
19
-
20
-
21
-
22
-
23
-
24
-
25
-
26
-
27
-
28
-
29
-
30
-
31
-
32
-
33
-
34
-
35
-
36
-
37
-
38
-
39
-
40
-
41
-
42
-
43
-
44
-
45
-
46
-
47
-
48
-
49
-
50
-
51
-
52
-
53
-
54
-
55
-
56
-
57
-
58
-
59
-
60
-
61
-
62
-
63
-
64
-
65
-
66
-
67
-
68
-
69
-
70
-
71
-
72
-
73
-
74
-
75
-
76
-
77
-
78
-
79
-
80
-
81
-
82
-
83
-
84
-
85
-
86
-
87
-
88
-
89
-
90
-
91
-
92
-
93
-
94
-
95
-
96
-
97
-
98
-
99
-
100
-
101
-
102
-
103
-
104
-
105
-
106
-
107
-
108
-
109
-
110
-
111
-
112
-
113
-
114
-
115
-
116
-
117
-
118
-
119
-
120
-
121
-
122
-
123
-
124
-
125
-
126
-
127
-
128
-
129
-
130
-
131
-
132
-
133
-
134
-
135
-
136
-
137
-
 138
138 -
 139
139 -
 140
140 -
 141
141 -
 142
142 -
 143
143 -
 144
144 -
 145
145 -
 146
146 -
 147
147 -
 148
148 -
 149
149 -
 150
150 -
 151
151 -
 152
152 -
 153
153 -
 154
154 -
 155
155 -
 156
156 -
 157
157 -
 158
158 -
159
-
160
-
161
-
162
-
163
-
164
-
165
-
166
-
167
-
168
-
169
-
170
-
171
-
172
-
173
-
174
-
175
-
176
-
177
-
178
-
179
-
180
-
181
-
182
-
183
-
184
-
185
-
186
-
187
-
188
-
189
-
190
-
191
-
192
-
193
-
194
-
195
-
196
-
197
-
198
-
199
 |
 |

13
RBS – Interim Results 2015
Appendix 1 Capital and risk management
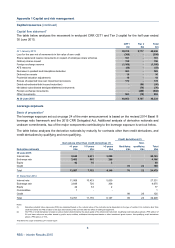
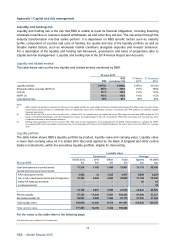
Liquidity and funding risk
Liquidity and funding risk is the risk that RBS is unable to meet its financial obligations, including financing
wholesale maturities or customer deposit withdrawals, as and when they fall due. The risk arises through the
maturity transformation role that banks perform. It is dependent on RBS specific factors such as maturity
profile, composition of sources and uses of funding, the quality and size of the liquidity portfolio as well as
broader market factors, such as wholesale market conditions alongside depositor and investor behaviour.
For a description of the liquidity and funding risk framework, governance and basis of preparation refer to
Capital and risk management - Liquidity and funding risk in the 2014 Annual Report and Accounts.
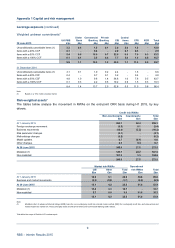
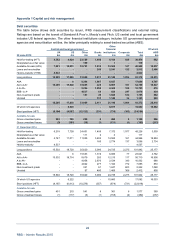
Liquidity and related metrics*
The table below sets out the key liquidity and related metrics monitored by RBS.
30 June 2015
RBS 31 March 31 Decembe
r
RBS excluding CFG 2015 2014
Liquidity portfolio £161bn £148bn £157bn £151bn
Stressed outflow coverage (SCR) (1) 215% 235% 187% 186%
LCR (2) 117% 118% 112% 112%
NSFR (3) 115% 112% 110% 112%
Loan:deposit ratio 92% 91% 95% 95%
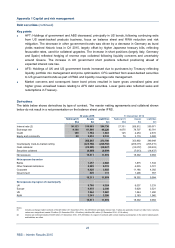
Notes:
(1) RBS's liquidity risk appetite is measured by reference to the liquidity portfolio as a percentage of stressed contractual and behavioural outflows under the worst of three
internal severe stress scenarios (a market-wide stress, an idiosyncratic stress and a combination of both) in accordance with PRA guidance on Individual Liquidity
Adequacy Assessment.
(2) Within the EU, the LCR is due to come into effect from 1 October 2015 on a phased basis, and replace the current PRA regime from this date. RBS monitors the LCR
based on its internal interpretations of the EU Delegated Act rules for the implementation of the LCR. Consequently, RBS’s ratio may change over time and may not be
comparable with those of other financial institutions.
(3) Pending further guidelines from the EU and the PRA, RBS uses its own interpretation of the proposals from the BCBS recommendations to calculate the NSFR.
Consequently RBS’s ratio may change over time and may not be comparable with those of other financial institutions. The ratio is due to come into effect from 1 Januar
y
2018.
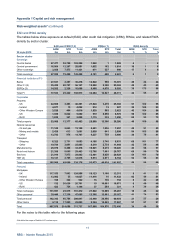
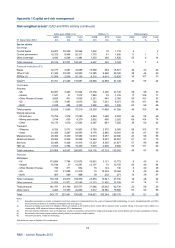
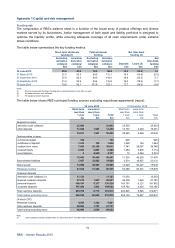
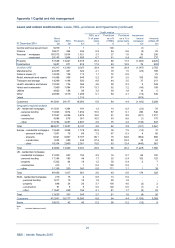
Liquidity portfolio
The table below shows RBS’s liquidity portfolio by product, liquidity value and carrying value. Liquidity value
is lower than carrying value as it is stated after discounts applied by the Bank of England and other central
banks to instruments, within the secondary liquidity portfolio, eligible for discounting.
Liquidity value
Period end Average
UK DLG (1) CFG Other Total Quarte
r
H1 2015
30 June 2015 £m £m £m £m £m £m
Cash and balances at central banks 73,218 1,183 1,406 75,807 71,113 66,392
Central and local government bonds
AAA rated governments 3,932 12 1,033 4,977 5,609 6,529
AA- to AA+ rated governments and US agencies 10,202 9,845 2,852 22,899 21,154 20,285
Below AA rated governments - - -- 80 91
Local government - - -- - 24
14,134 9,857 3,885 27,876 26,843 26,929
Primary liquidity 87,352 11,040 5,291 103,683 97,956 93,321
Secondary liquidity (2) 54,667 2,085 1,022 57,774 57,586 57,024
Total liquidity value 142,019 13,125 6,313 161,457 155,542 150,345
Total carrying value 177,485 14,199 7,262 198,946
For the notes to this table refer to the following page.
*Not within the scope of Deloitte LLP’s review report