RBS 2014 Annual Report Download - page 24
Download and view the complete annual report
Please find page 24 of the 2014 RBS annual report below. You can navigate through the pages in the report by either clicking on the pages listed below, or by using the keyword search tool below to find specific information within the annual report.-
 1
1 -
2
-
3
-
4
-
5
-
6
-
7
-
8
-
9
-
10
-
11
-
12
-
13
-
 14
14 -
 15
15 -
 16
16 -
 17
17 -
 18
18 -
 19
19 -
 20
20 -
 21
21 -
 22
22 -
 23
23 -
 24
24 -
 25
25 -
 26
26 -
 27
27 -
 28
28 -
 29
29 -
 30
30 -
 31
31 -
 32
32 -
 33
33 -
 34
34 -
35
-
36
-
37
-
38
-
39
-
40
-
41
-
42
-
43
-
44
-
45
-
46
-
47
-
48
-
49
-
50
-
51
-
52
-
53
-
54
-
55
-
56
-
57
-
58
-
59
-
60
-
61
-
62
-
63
-
64
-
65
-
66
-
67
-
68
-
69
-
70
-
71
-
72
-
73
-
74
-
75
-
76
-
77
-
78
-
79
-
80
-
81
-
82
-
83
-
84
-
85
-
86
-
87
-
88
-
89
-
90
-
91
-
92
-
93
-
94
-
95
-
96
-
97
-
98
-
99
-
100
-
101
-
102
-
103
-
104
-
105
-
106
-
107
-
108
-
109
-
110
-
111
-
112
-
113
-
114
-
115
-
116
-
117
-
118
-
119
-
120
-
121
-
122
-
123
-
124
-
125
-
126
-
127
-
128
-
129
-
130
-
131
-
132
-
133
-
134
-
135
-
136
-
137
-
138
-
139
-
140
-
141
-
142
-
143
-
144
-
145
-
146
-
147
-
148
-
149
-
150
-
151
-
152
-
153
-
154
-
155
-
156
-
157
-
158
-
159
-
160
-
161
-
162
-
163
-
164
-
165
-
166
-
167
-
168
-
169
-
170
-
171
-
172
-
173
-
174
-
175
-
176
-
177
-
178
-
179
-
180
-
181
-
182
-
183
-
184
-
185
-
186
-
187
-
188
-
189
-
190
-
191
-
192
-
193
-
194
-
195
-
196
-
197
-
198
-
199
 |
 |

22
RBS – Interim Results 2015
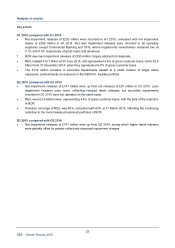
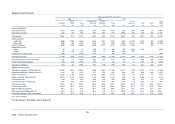
Analysis of results
Half year ended Quarter ended
30 June 30 June 30 June 31 March 30 June
2015 2014 2015 2015 2014
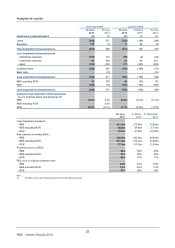
Impairment (releases)/losses £m £m £m £m £m
Loans (342) 271 (152) (190) (89)
Securities 110 (2) 11 99 (4)
Total impairment (releases)/losses (232) 269 (141) (91) (93)
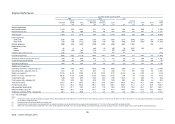
Loan impairment (releases)/losses
- individually assessed (102) 113 (96) (6) (42)
- collectively assessed 90 348 21 69 221
- latent (330) (180) (77) (253) (258)
Customer loans (342) 281 (152) (190) (79)
Bank loans - (10) - - (10)
Loan impairment (releases)/losses (342) 271 (152) (190) (89)
RBS excluding RCR 13 290 43 (30) 36
RCR (355) (19) (195) (160) (125)
Loan impairment (releases)/losses (342) 271 (152) (190) (89)
Customer loan impairment (releases)/losses
as a % of gross loans and advances (1)
RBS (0.2%) 0.1% (0.2%) (0.2%) (0.1%)
RBS excluding RCR - 0.2% - - -
RCR (6.5%) (0.1%) (7.1%) (4.2%) (1.7%)
30 June 31 March 31 December
2015 2015 2014
Loan impairment provisions
- RBS £11.3bn £13.8bn £18.0bn
- RBS excluding RCR £6.2bn £6.6bn £7.1bn
- RCR £5.1bn £7.2bn £10.9bn
Risk elements in lending (REIL)
- RBS £18.7bn £22.3bn £28.2bn
- RBS excluding RCR £11.3bn £12.1bn £12.8bn
- RCR £7.4bn £10.2bn £15.4bn
Provisions as a % of REIL
- RBS 60% 62% 64%
- RBS excluding RCR 54% 55% 55%
- RCR 69% 70% 71%
REIL as a % of gross customer loans
- RBS 4.8% 5.4% 6.8%
- RBS excluding RCR 3.0% 3.0% 3.3%
- RCR 67% 68% 70%
Note:
(1) Excludes reverse repurchase agreements and includes disposals groups.