RBS 2014 Annual Report Download - page 170
Download and view the complete annual report
Please find page 170 of the 2014 RBS annual report below. You can navigate through the pages in the report by either clicking on the pages listed below, or by using the keyword search tool below to find specific information within the annual report.-
 1
1 -
2
-
3
-
4
-
5
-
6
-
7
-
8
-
9
-
10
-
11
-
12
-
13
-
14
-
15
-
16
-
17
-
18
-
19
-
20
-
21
-
22
-
23
-
24
-
25
-
26
-
27
-
28
-
29
-
30
-
31
-
32
-
33
-
34
-
35
-
36
-
37
-
38
-
39
-
40
-
41
-
42
-
43
-
44
-
45
-
46
-
47
-
48
-
49
-
50
-
51
-
52
-
53
-
54
-
55
-
56
-
57
-
58
-
59
-
60
-
61
-
62
-
63
-
64
-
65
-
66
-
67
-
68
-
69
-
70
-
71
-
72
-
73
-
74
-
75
-
76
-
77
-
78
-
79
-
80
-
81
-
82
-
83
-
84
-
85
-
86
-
87
-
88
-
89
-
90
-
91
-
92
-
93
-
94
-
95
-
96
-
97
-
98
-
99
-
100
-
101
-
102
-
103
-
104
-
105
-
106
-
107
-
108
-
109
-
110
-
111
-
112
-
113
-
114
-
115
-
116
-
117
-
118
-
119
-
120
-
121
-
122
-
123
-
124
-
125
-
126
-
127
-
128
-
129
-
130
-
131
-
132
-
133
-
134
-
135
-
136
-
137
-
138
-
139
-
140
-
141
-
142
-
143
-
144
-
145
-
146
-
147
-
148
-
149
-
150
-
151
-
152
-
153
-
154
-
155
-
156
-
157
-
158
-
159
-
 160
160 -
 161
161 -
 162
162 -
 163
163 -
 164
164 -
 165
165 -
 166
166 -
 167
167 -
 168
168 -
 169
169 -
 170
170 -
 171
171 -
 172
172 -
 173
173 -
 174
174 -
 175
175 -
 176
176 -
 177
177 -
 178
178 -
 179
179 -
 180
180 -
181
-
182
-
183
-
184
-
185
-
186
-
187
-
188
-
189
-
190
-
191
-
192
-
193
-
194
-
195
-
196
-
197
-
198
-
199
 |
 |

35
RBS – Interim Results 2015
Appendix 1 Capital and risk management
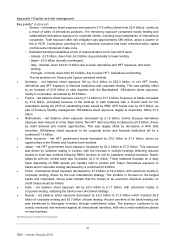
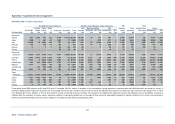
Trading portfolios (continued)
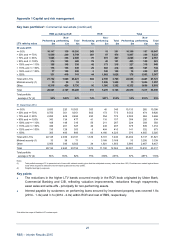
Capital charges*
The total market risk minimum capital requirement calculated in accordance with CRR was £1,786 million at
30 June 2015 (31 December 2014 - £1,917 million), representing RWAs of £22.3 billion (31 December 2014
- £24.0 billion). It comprised two categories: (i) the Pillar 1 model-based position risk requirement (PRR) of
£1,497 million (31 December 2014 - £1,458 million), which in turn comprised several modelled charges; and
(ii) the standardised PRR of £289 million (31 December 2014 - £459 million), which also had several
components.
The components of the Pillar 1 model-based PRR are presented in the table below.
31 Decembe
r
2014
Average Maximum Minimum Period end Period end
30 June 2015 £m £m £m £m £m
Value-at-risk 362 400 333 400 329
Stressed VaR (SVaR) 527 555 492 555 511
Incremental risk charge (IRC) 294 348 271 288 299
Risk not in VaR (RNIV) 284 319 227 254 319
1,497 1,458
Key points
• The total model-based PRR increased by 3% in the half year to 30 June 2015, driven by higher VaR
and SVaR based capital charges, offset somewhat by the lower RNIV capital charge.
• The VaR and SVaR capital charges together increased by 14%, reflecting increased positioning by the
rates business during Q2 2015, notably relating to euro rates, following market euro sell-off in May.
• The RNIV charge fell by 20%, primarily in stressed RNIVs following reductions in inflation basis risk in
the rates business.
• Standardised charges were 37% or £170 million lower than at the 2014 year end, primarily driven by
reduced securitisation exposures in the trading book reflecting the continuation of the US ABP exit, UK
ABP risk reduction and the continuation of RCR disposals.
• All entities maintained a green status relating to regulatory back-testing during H1 2015 except fo
r
NatWest Plc, which had six exceptions during the 250 business days ending 30 June 2015, mainly
driven by market volatility. This resulted in a £49 million increase to market risk RWAs.
*Not within the scope of Deloitte LLP’s review report