RBS 2014 Annual Report Download - page 18
Download and view the complete annual report
Please find page 18 of the 2014 RBS annual report below. You can navigate through the pages in the report by either clicking on the pages listed below, or by using the keyword search tool below to find specific information within the annual report.-
 1
1 -
2
-
3
-
4
-
5
-
6
-
7
-
 8
8 -
 9
9 -
 10
10 -
 11
11 -
 12
12 -
 13
13 -
 14
14 -
 15
15 -
 16
16 -
 17
17 -
 18
18 -
 19
19 -
 20
20 -
 21
21 -
 22
22 -
 23
23 -
 24
24 -
 25
25 -
 26
26 -
 27
27 -
 28
28 -
29
-
30
-
31
-
32
-
33
-
34
-
35
-
36
-
37
-
38
-
39
-
40
-
41
-
42
-
43
-
44
-
45
-
46
-
47
-
48
-
49
-
50
-
51
-
52
-
53
-
54
-
55
-
56
-
57
-
58
-
59
-
60
-
61
-
62
-
63
-
64
-
65
-
66
-
67
-
68
-
69
-
70
-
71
-
72
-
73
-
74
-
75
-
76
-
77
-
78
-
79
-
80
-
81
-
82
-
83
-
84
-
85
-
86
-
87
-
88
-
89
-
90
-
91
-
92
-
93
-
94
-
95
-
96
-
97
-
98
-
99
-
100
-
101
-
102
-
103
-
104
-
105
-
106
-
107
-
108
-
109
-
110
-
111
-
112
-
113
-
114
-
115
-
116
-
117
-
118
-
119
-
120
-
121
-
122
-
123
-
124
-
125
-
126
-
127
-
128
-
129
-
130
-
131
-
132
-
133
-
134
-
135
-
136
-
137
-
138
-
139
-
140
-
141
-
142
-
143
-
144
-
145
-
146
-
147
-
148
-
149
-
150
-
151
-
152
-
153
-
154
-
155
-
156
-
157
-
158
-
159
-
160
-
161
-
162
-
163
-
164
-
165
-
166
-
167
-
168
-
169
-
170
-
171
-
172
-
173
-
174
-
175
-
176
-
177
-
178
-
179
-
180
-
181
-
182
-
183
-
184
-
185
-
186
-
187
-
188
-
189
-
190
-
191
-
192
-
193
-
194
-
195
-
196
-
197
-
198
-
199
 |
 |

16
RBS – Interim Results 2015
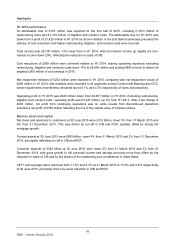
Highlights
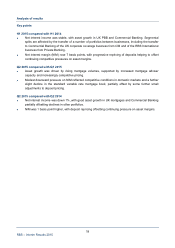
H1 2015 performance
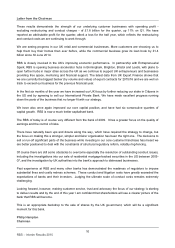
An attributable loss of £153 million was reported for the first half of 2015, including £1,503 million of
restructuring costs and £1,315 million of litigation and conduct costs. The attributable loss for H1 2015 was
down from a profit of £1,425 million in H1 2014 as income attrition in the Exit Bank businesses preceded the
delivery of cost reductions and higher restructuring, litigation, and conduct costs were incurred.
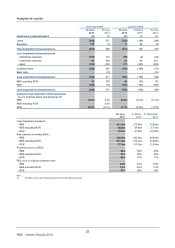
Total income was £8,700 million, 13% lower than in H1 2014, with net interest income up slightly but non-
interest income down 29%, reflecting the reduction in scale of CIB.
Cost reductions of £859 million were achieved relative to H1 2014, leaving operating expenses excluding
restructuring, litigation and conducts costs down 14% at £5,485 million and putting RBS on track to deliver its
targeted £800 million of cost savings in 2015.
Net impairment releases of £232 million were reported in H1 2015, compared with net impairment losses of
£269 million in H1 2014. Net releases were recorded in all segments except Commercial Banking and CFG,
where impairments nevertheless remained low at 0.1% and 0.3% respectively of loans and advances.
Operating profit in H1 2015 was £629 million down from £2,601 million in H1 2014. Excluding restructuring,
litigation and conduct costs, operating profit was £3,447 million, up 2% from H1 2014. After a tax charge of
£293 million, net profit from continuing operations was nil, while results from discontinued operations
included a net profit of £354 million reflecting the rise in the market value of Citizens shares.
Balance sheet and capital
Net loans and advances to customers at 30 June 2015 were £315 billion, down 5% from 31 March 2015 and
6% from 31 December 2014. This was driven by run-off in CIB and RCR, partially offset by strong UK
mortgage growth.
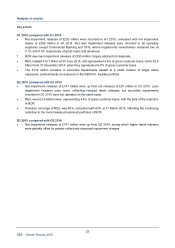
Funded assets at 30 June 2015 were £683 billion, down 4% from 31 March 2015 and 2% from 31 December
2014, principally reflecting run-off in CIB and RCR.
Customer deposits of £342 billion at 30 June 2015 were down 2% from 31 March 2015 and 3% from 31
December 2014, with good growth in UK personal current and savings accounts more than offset by the
reduction in scale of CIB and by the impact of the weakening euro on balances in Ulster Bank.
CET1 and leverage ratios improved from 11.5% and 4.3% at 31 March 2015 to 12.3% and 4.6% respectively
at 30 June 2015, principally driven by asset reduction in CIB and RCR.