RBS 2014 Annual Report Download - page 168
Download and view the complete annual report
Please find page 168 of the 2014 RBS annual report below. You can navigate through the pages in the report by either clicking on the pages listed below, or by using the keyword search tool below to find specific information within the annual report.-
 1
1 -
2
-
3
-
4
-
5
-
6
-
7
-
8
-
9
-
10
-
11
-
12
-
13
-
14
-
15
-
16
-
17
-
18
-
19
-
20
-
21
-
22
-
23
-
24
-
25
-
26
-
27
-
28
-
29
-
30
-
31
-
32
-
33
-
34
-
35
-
36
-
37
-
38
-
39
-
40
-
41
-
42
-
43
-
44
-
45
-
46
-
47
-
48
-
49
-
50
-
51
-
52
-
53
-
54
-
55
-
56
-
57
-
58
-
59
-
60
-
61
-
62
-
63
-
64
-
65
-
66
-
67
-
68
-
69
-
70
-
71
-
72
-
73
-
74
-
75
-
76
-
77
-
78
-
79
-
80
-
81
-
82
-
83
-
84
-
85
-
86
-
87
-
88
-
89
-
90
-
91
-
92
-
93
-
94
-
95
-
96
-
97
-
98
-
99
-
100
-
101
-
102
-
103
-
104
-
105
-
106
-
107
-
108
-
109
-
110
-
111
-
112
-
113
-
114
-
115
-
116
-
117
-
118
-
119
-
120
-
121
-
122
-
123
-
124
-
125
-
126
-
127
-
128
-
129
-
130
-
131
-
132
-
133
-
134
-
135
-
136
-
137
-
138
-
139
-
140
-
141
-
142
-
143
-
144
-
145
-
146
-
147
-
148
-
149
-
150
-
151
-
152
-
153
-
154
-
155
-
156
-
157
-
 158
158 -
 159
159 -
 160
160 -
 161
161 -
 162
162 -
 163
163 -
 164
164 -
 165
165 -
 166
166 -
 167
167 -
 168
168 -
 169
169 -
 170
170 -
 171
171 -
 172
172 -
 173
173 -
 174
174 -
 175
175 -
 176
176 -
 177
177 -
 178
178 -
179
-
180
-
181
-
182
-
183
-
184
-
185
-
186
-
187
-
188
-
189
-
190
-
191
-
192
-
193
-
194
-
195
-
196
-
197
-
198
-
199
 |
 |

33
RBS – Interim Results 2015
Appendix 1 Capital and risk management
Key points* (continued)
Ulster Bank (continued)
• The number of customers approaching Ulster Bank for the first time in respect to forbearance
assistance declined through H1 2015. The majority (78%) of forbearance arrangements were less than
90 days in arrears.
• There was an overall release of impairment provisions for personal mortgages in H1 2015 compared
with a charge in H1 2014. Reducing defaulted balances have reduced loss expectations driving
collective and latent releases.
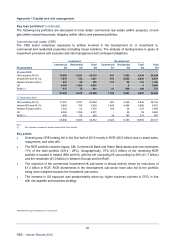
CFG
• The mortgage portfolio at 30 June 2015 consisted of £8 billion of residential mortgages (1% in second
lien position) and £12.5 billion of home equity loans and lines of credit (HELOC) - first and second
liens. Home equity consisted of 46% in first lien position. A Serviced By Others (SBO) portfolio, which
is predominantly (95%) second lien, is included in the home equity book. Excluding the effect o
f
exchange rates, the portfolio decreased 2% from the 2014 year end as a result of contraction in
HELOC and run-off in the construction legacy serviced by others portfolios.
• CFG continued to focus on its footprint states of New England, Mid-Atlantic and the Mid-West. At 30
June 2015, £16.7 billion (81% of the total portfolio) was within footprint.
• The SBO portfolio, which was closed to new purchases in Q3 2007, decreased from £1.3 billion in Q1
2015 to £1.1 billion in Q2 2015.
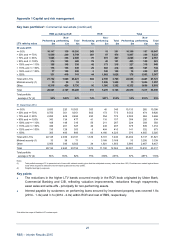
• The overall mortgage portfolio credit characteristics are stable with a weighted average LTV of 65% at
30 June 2015. The weighted average LTV of the portfolio, excluding SBO, was 63%.
• CFG participates in the US-government mandated Home Affordable Modification Program (HAMP), as
well as its own proprietary programme. The 12-month default rate, on a value basis, for customers
who were granted forbearance, was 17.4% in H1 2015 (2014 - 15%). The increase in default rate was
driven by a regulatory requirement to start tracking co-borrower bankruptcies. Additionally, many
HAMP mortgages, which receive a below market rate for five years, began to reset at higher rates to
adjust to the market rate, increasing defaults.
*Not within the scope of Deloitte LLP’s review report