RBS 2014 Annual Report Download - page 36
Download and view the complete annual report
Please find page 36 of the 2014 RBS annual report below. You can navigate through the pages in the report by either clicking on the pages listed below, or by using the keyword search tool below to find specific information within the annual report.-
 1
1 -
2
-
3
-
4
-
5
-
6
-
7
-
8
-
9
-
10
-
11
-
12
-
13
-
14
-
15
-
16
-
17
-
18
-
19
-
20
-
21
-
22
-
23
-
24
-
25
-
 26
26 -
 27
27 -
 28
28 -
 29
29 -
 30
30 -
 31
31 -
 32
32 -
 33
33 -
 34
34 -
 35
35 -
 36
36 -
 37
37 -
 38
38 -
 39
39 -
 40
40 -
 41
41 -
 42
42 -
 43
43 -
 44
44 -
 45
45 -
 46
46 -
47
-
48
-
49
-
50
-
51
-
52
-
53
-
54
-
55
-
56
-
57
-
58
-
59
-
60
-
61
-
62
-
63
-
64
-
65
-
66
-
67
-
68
-
69
-
70
-
71
-
72
-
73
-
74
-
75
-
76
-
77
-
78
-
79
-
80
-
81
-
82
-
83
-
84
-
85
-
86
-
87
-
88
-
89
-
90
-
91
-
92
-
93
-
94
-
95
-
96
-
97
-
98
-
99
-
100
-
101
-
102
-
103
-
104
-
105
-
106
-
107
-
108
-
109
-
110
-
111
-
112
-
113
-
114
-
115
-
116
-
117
-
118
-
119
-
120
-
121
-
122
-
123
-
124
-
125
-
126
-
127
-
128
-
129
-
130
-
131
-
132
-
133
-
134
-
135
-
136
-
137
-
138
-
139
-
140
-
141
-
142
-
143
-
144
-
145
-
146
-
147
-
148
-
149
-
150
-
151
-
152
-
153
-
154
-
155
-
156
-
157
-
158
-
159
-
160
-
161
-
162
-
163
-
164
-
165
-
166
-
167
-
168
-
169
-
170
-
171
-
172
-
173
-
174
-
175
-
176
-
177
-
178
-
179
-
180
-
181
-
182
-
183
-
184
-
185
-
186
-
187
-
188
-
189
-
190
-
191
-
192
-
193
-
194
-
195
-
196
-
197
-
198
-
199
 |
 |

34
RBS – Interim Results 2015
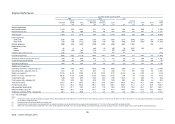
UK Personal & Business Banking
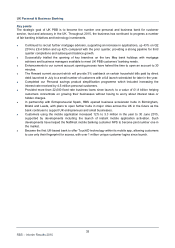
Key points (continued)
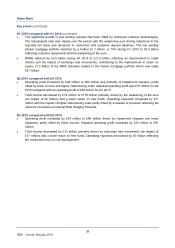
H1 2015 compared with H1 2014
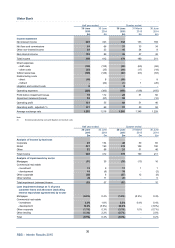
• Operating profit increased £21 million to £1,015 million for H1 2015 with a net impairment release
largely offset by higher conduct costs. Adjusted operating profit of £1,429 million was £266 million
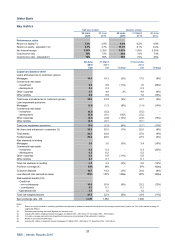
higher as adjusted operating expenses decreased by 9%. Return on equity rose 1.8 percentage points
to 23.6%.
• Total income decreased £41 million to £2,921 million. Net interest income increased by 1% to £2,290
million driven by improved deposit income from increased balances and stronger margins partly offset
by lower asset income as a result of asset margin compression outweighing strong balance shee
t
growth.
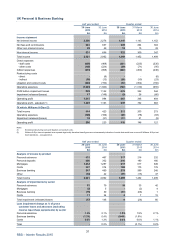
• Net interest margin decreased from 3.62% to 3.59% reflecting strong new business mortgage growth
at lower margin, together with an increase in the level of standard variable rate customers switching to
new lower margin fixed rate products. This has been partly offset by a continued improvement in
deposit margins.
• Non-interest income decreased by 8% to £631 million reflecting the impacts of changes that were
introduced to support customers, in particular current account charges and investment fund charges.
In addition, card interchange income fell as a result of the implementation of EU regulations on
interchange rates.
• Operating expenses increased by £103 million or 6%, largely reflecting higher restructuring costs and
litigation and conduct costs from increased levels of customer redress provision. Adjusted expenses
were £142 million or 9% lower, supported by a headcount decrease of 4%, lower FSCS levy charges
and lower complaints and compensation costs. Indirect expenses were £45 million lower largely due
to the non-repeat of a £60 million technology write-off in the first half of 2014.
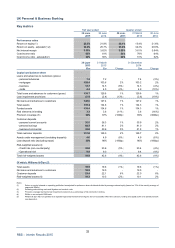
• A £17 million net impairment release compared with a net loss of £148 million, resulting from lowe
r
levels of defaults across all portfolios and increased portfolio provision releases, particularly in
business banking.
• Mortgage balances increased to £105.4 billion, up £3.6 billion year-on-year, or 4% above the overall
mortgage market for the same period. Gross new mortgage lending in the first half of 2015 was £9.1
billion representing a market share of approximately 9%, above our stock share of 8%. Deposi
t
balances increased £5.0 billion driven by instant access growth in personal savings, current accounts
and business.
• RWAs declined 13% to £41.0 billion primarily due to improved credit quality and lower unsecured
balances.