RBS 2014 Annual Report Download - page 190
Download and view the complete annual report
Please find page 190 of the 2014 RBS annual report below. You can navigate through the pages in the report by either clicking on the pages listed below, or by using the keyword search tool below to find specific information within the annual report.-
 1
1 -
2
-
3
-
4
-
5
-
6
-
7
-
8
-
9
-
10
-
11
-
12
-
13
-
14
-
15
-
16
-
17
-
18
-
19
-
20
-
21
-
22
-
23
-
24
-
25
-
26
-
27
-
28
-
29
-
30
-
31
-
32
-
33
-
34
-
35
-
36
-
37
-
38
-
39
-
40
-
41
-
42
-
43
-
44
-
45
-
46
-
47
-
48
-
49
-
50
-
51
-
52
-
53
-
54
-
55
-
56
-
57
-
58
-
59
-
60
-
61
-
62
-
63
-
64
-
65
-
66
-
67
-
68
-
69
-
70
-
71
-
72
-
73
-
74
-
75
-
76
-
77
-
78
-
79
-
80
-
81
-
82
-
83
-
84
-
85
-
86
-
87
-
88
-
89
-
90
-
91
-
92
-
93
-
94
-
95
-
96
-
97
-
98
-
99
-
100
-
101
-
102
-
103
-
104
-
105
-
106
-
107
-
108
-
109
-
110
-
111
-
112
-
113
-
114
-
115
-
116
-
117
-
118
-
119
-
120
-
121
-
122
-
123
-
124
-
125
-
126
-
127
-
128
-
129
-
130
-
131
-
132
-
133
-
134
-
135
-
136
-
137
-
138
-
139
-
140
-
141
-
142
-
143
-
144
-
145
-
146
-
147
-
148
-
149
-
150
-
151
-
152
-
153
-
154
-
155
-
156
-
157
-
158
-
159
-
160
-
161
-
162
-
163
-
164
-
165
-
166
-
167
-
168
-
169
-
170
-
171
-
172
-
173
-
174
-
175
-
176
-
177
-
178
-
179
-
 180
180 -
 181
181 -
 182
182 -
 183
183 -
 184
184 -
 185
185 -
 186
186 -
 187
187 -
 188
188 -
 189
189 -
 190
190 -
 191
191 -
 192
192 -
 193
193 -
 194
194 -
 195
195 -
 196
196 -
 197
197 -
 198
198 -
 199
199
 |
 |

3
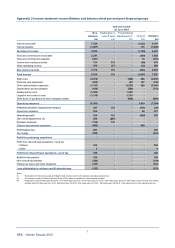
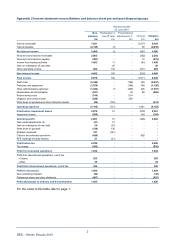
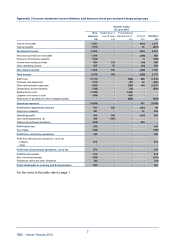
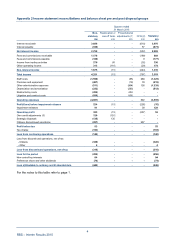
RBS – Interim Results 2015
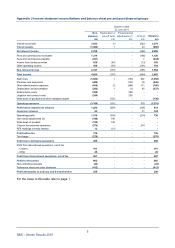
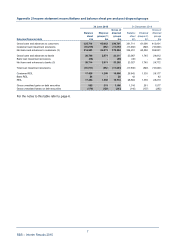
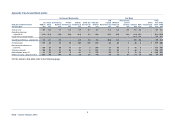
Appendix 3 Go-forward Bank profile
Go-forward Bank profile Exit Bank
International Total
UK Ulste
r
Commercial Private CIB Go- Other Go- Total Go- CIB Capital Williams private Othe
r
Exit Total
Year ended and as at PBB (1) Bank Banking Banking (2) forward (3) forward (4) forward Resolution(3) & Glyn (5) banking Citizens RCR investments Bank RBS
31 December 2014 £bn £bn £bn £bn £bn £bn £bn £bn £bn £bn £bn £bn £bn £bn £bn
Total income 5.2 0.8 3.2 0.9 2.2 (0.1) 12.2 1.7 0.9 0.2 3.1 - 0.1 6.0 18.2
Operating expenses
- adjusted (6) (3.0) (0.6) (1.6) (0.7) (1.9) 0.1 (7.7) (1.7) (0.5) (0.2) (2.0) (0.3) -(4.7) (12.4)
Impairment (losses)/releases (0.2) 0.4 (0.1) -- - 0.1 - (0.1) - (0.2) 1.3 0.1 1.1 1.2
Operating profit - adjusted (6) 2.0 0.6 1.5 0.2 0.3 - 4.6 - 0.3 - 0.9 1.0 0.2 2.4 7.0
Funded assets 115 28 89 15 146 87 480 95 20 5 81 15 1217 697
Net loans and advances to
customers 108 22 85 13 31 - 259 42 20 3 60 11 -136 395
Customer deposits 127 21 87 29 23 1 288 36 22 8 61 1 -128 416
Risk-weighted assets 33 24 64 10 43 10 184 64 10 2 68 22 6172 356
Return on equity - adjusted (6,8,9) 29% 17% 11% 12% nm nm 11% nm nm 10% 7% nm 3% 7% 9%
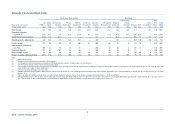
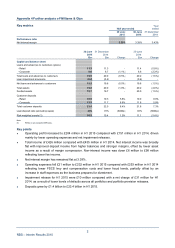
Notes:
(1) Excludes Williams & Glyn.
(2) Excludes international private banking reclassified to disposal groups.
(3) The CIB segment is being restructured into Go-forward and CIB Capital Resolution elements. The split is subject to further refinement.
(4) Other Go-forward is primarily Centre, which includes the liquidity portfolio.
(5) Does not reflect the cost base, funding and capital profile of a standalone bank. Operating expenses include charges based on an attribution of support provided by RBS to Williams & Glyn. Expenses incurred by Williams & Glyn were £91 million (Q1 2015 - £80
million; H1 2015 - £171 million; FY 2014 - £352 million).
(6) Excludes restructuring and litigation and conduct costs.
(7) CIB RWAs £43 billion includes £9 billion of RWAs related to businesses that will transfer out of CIB, comprising the Western European large corporate portfolio (expected to move to Commercial Banking in H2 2015) and UK Transaction Services (to Commercial
Banking in 2016).
(8) ROE is calculated using operating profit after tax on a non-statutory basis adjusted for preference share dividends divided by average notional equity (based on 13% of average RWAe).
(9) PBB adjusted ROE Q2 2015 - 29% (Q1 2015 - 27%; H1 2015 - 28%; FY 2014 - 26%). CPB adjusted ROE Q2 2015 - 13% (Q1 2015 - 11%; H1 2015 - 12%; FY 2014 - 11%). Excluding IFRS volatility gain of Q2 2015 - £205 million (Q1 2015 - loss £123 million; H1
2015 - gain £82 million; FY 2014 - loss £468 million), the Go-forward Bank’s adjusted return on equity was Q2 2015 - 14% (Q1 2015 - 13%; H1 2015 - 14%; FY 2014 - 13%).