RBS 2014 Annual Report Download - page 161
Download and view the complete annual report
Please find page 161 of the 2014 RBS annual report below. You can navigate through the pages in the report by either clicking on the pages listed below, or by using the keyword search tool below to find specific information within the annual report.-
 1
1 -
2
-
3
-
4
-
5
-
6
-
7
-
8
-
9
-
10
-
11
-
12
-
13
-
14
-
15
-
16
-
17
-
18
-
19
-
20
-
21
-
22
-
23
-
24
-
25
-
26
-
27
-
28
-
29
-
30
-
31
-
32
-
33
-
34
-
35
-
36
-
37
-
38
-
39
-
40
-
41
-
42
-
43
-
44
-
45
-
46
-
47
-
48
-
49
-
50
-
51
-
52
-
53
-
54
-
55
-
56
-
57
-
58
-
59
-
60
-
61
-
62
-
63
-
64
-
65
-
66
-
67
-
68
-
69
-
70
-
71
-
72
-
73
-
74
-
75
-
76
-
77
-
78
-
79
-
80
-
81
-
82
-
83
-
84
-
85
-
86
-
87
-
88
-
89
-
90
-
91
-
92
-
93
-
94
-
95
-
96
-
97
-
98
-
99
-
100
-
101
-
102
-
103
-
104
-
105
-
106
-
107
-
108
-
109
-
110
-
111
-
112
-
113
-
114
-
115
-
116
-
117
-
118
-
119
-
120
-
121
-
122
-
123
-
124
-
125
-
126
-
127
-
128
-
129
-
130
-
131
-
132
-
133
-
134
-
135
-
136
-
137
-
138
-
139
-
140
-
141
-
142
-
143
-
144
-
145
-
146
-
147
-
148
-
149
-
150
-
 151
151 -
 152
152 -
 153
153 -
 154
154 -
 155
155 -
 156
156 -
 157
157 -
 158
158 -
 159
159 -
 160
160 -
 161
161 -
 162
162 -
 163
163 -
 164
164 -
 165
165 -
 166
166 -
 167
167 -
 168
168 -
 169
169 -
 170
170 -
 171
171 -
172
-
173
-
174
-
175
-
176
-
177
-
178
-
179
-
180
-
181
-
182
-
183
-
184
-
185
-
186
-
187
-
188
-
189
-
190
-
191
-
192
-
193
-
194
-
195
-
196
-
197
-
198
-
199
 |
 |

26
RBS – Interim Results 2015
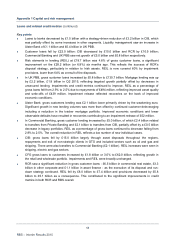
Appendix 1 Capital and risk management
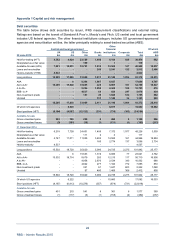
Key loan portfolios* (continued)
The following key portfolios are discussed in more detail: commercial real estate (within property); oil and
gas (within natural resources); shipping (within other); and personal portfolios.
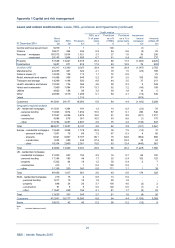
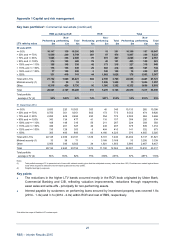
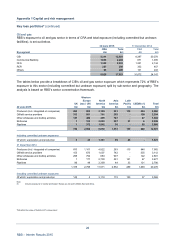
Commercial real estate (CRE)
The CRE sector comprises exposures to entities involved in the development of, or investment in,
commercial and residential properties (including house builders). The analysis of lending below is gross of
impairment provisions and excludes rate risk management and contingent obligations
Investment Development
Commercial Residential Total Commercial Residential Total Total
By geography £m £m £m £m £m £m £m
30 June 2015
UK (excluding NI (1)) 15,959 4,351 20,310 541 3,393 3,934 24,244
Ireland (ROI and NI (1)) 1,519 312 1,831 614 2,022 2,636 4,467
Western Europe (other) 947 29 976 110 22 132 1,108
US 4,489 1,362 5,851 - 5 5 5,856
RoW (1) 415 16 431 41 249 290 721
23,329 6,070 29,399 1,306 5,691 6,997 36,396
31 December 2014
UK (excluding NI (1)) 17,327 4,757 22,084 600 3,446 4,046 26,130
Ireland (ROI and NI (1)) 2,864 740 3,604 1,499 4,469 5,968 9,572
Western Europe (other) 1,222 53 1,275 189 24 213 1,488
US 4,063 1,358 5,421 - 59 59 5,480
RoW (1) 406 22 428 34 185 219 647
25,882 6,930 32,812 2,322 8,183 10,505 43,317
Note:
(1) ROI: Republic of Ireland; NI: Northern Ireland; RoW: Rest of World.
Key points
• Overall gross CRE lending fell in the first half of 2015 mostly in RCR (£6.5 billion) due to asset sales,
repayments, and write-offs.
• The RCR portfolio contains legacy CIB, Commercial Bank and Ulster Bank assets and now represents
17% of the total portfolio (2014 - 29%). Geographically, 57% (£3.5 billion) of the remaining RCR
portfolio is located in Ireland (ROI and NI), with the UK (excluding NI) accounting for 28% (£1.7 billion)
and the remainder (£1.0 billion) in Western Europe and the RoW.
• The reduction of the commercial investment UK sub-sector is almost entirely driven by reductions o
f
£1.3 billion in RCR. RCR divestments in the development sub-sector have also led to the portfolio
being more weighted towards the investment sub-sector.
• The increase in US exposure was predominantly driven by higher business volumes in CFG, in line
with risk appetite and business strategy.
*Not within the scope of Deloitte LLP’s review report