RBS 2014 Annual Report Download - page 95
Download and view the complete annual report
Please find page 95 of the 2014 RBS annual report below. You can navigate through the pages in the report by either clicking on the pages listed below, or by using the keyword search tool below to find specific information within the annual report.-
 1
1 -
2
-
3
-
4
-
5
-
6
-
7
-
8
-
9
-
10
-
11
-
12
-
13
-
14
-
15
-
16
-
17
-
18
-
19
-
20
-
21
-
22
-
23
-
24
-
25
-
26
-
27
-
28
-
29
-
30
-
31
-
32
-
33
-
34
-
35
-
36
-
37
-
38
-
39
-
40
-
41
-
42
-
43
-
44
-
45
-
46
-
47
-
48
-
49
-
50
-
51
-
52
-
53
-
54
-
55
-
56
-
57
-
58
-
59
-
60
-
61
-
62
-
63
-
64
-
65
-
66
-
67
-
68
-
69
-
70
-
71
-
72
-
73
-
74
-
75
-
76
-
77
-
78
-
79
-
80
-
81
-
82
-
83
-
84
-
 85
85 -
 86
86 -
 87
87 -
 88
88 -
 89
89 -
 90
90 -
 91
91 -
 92
92 -
 93
93 -
 94
94 -
 95
95 -
 96
96 -
 97
97 -
 98
98 -
 99
99 -
 100
100 -
 101
101 -
 102
102 -
 103
103 -
 104
104 -
 105
105 -
106
-
107
-
108
-
109
-
110
-
111
-
112
-
113
-
114
-
115
-
116
-
117
-
118
-
119
-
120
-
121
-
122
-
123
-
124
-
125
-
126
-
127
-
128
-
129
-
130
-
131
-
132
-
133
-
134
-
135
-
136
-
137
-
138
-
139
-
140
-
141
-
142
-
143
-
144
-
145
-
146
-
147
-
148
-
149
-
150
-
151
-
152
-
153
-
154
-
155
-
156
-
157
-
158
-
159
-
160
-
161
-
162
-
163
-
164
-
165
-
166
-
167
-
168
-
169
-
170
-
171
-
172
-
173
-
174
-
175
-
176
-
177
-
178
-
179
-
180
-
181
-
182
-
183
-
184
-
185
-
186
-
187
-
188
-
189
-
190
-
191
-
192
-
193
-
194
-
195
-
196
-
197
-
198
-
199
 |
 |

93
RBS – Interim Results 2015
Notes
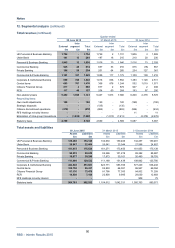
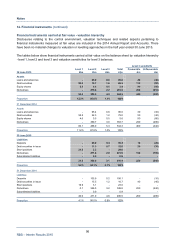
14. Financial instruments
Classification
The following tables analyse financial assets and liabilities in accordance with the categories of financial
instruments in IAS 39 with assets and liabilities outside the scope of IAS 39 shown separately.
Non
Financial instruments financial
Amortised Finance assets/
HFT (1) DFV (2) AFS (3) LAR (4) HTM (5) cost leases liabilities Total
30 June 2015 £m £m £m £m £m £m £m £m £m
Assets
Cash and balances at central banks - - - 81,900 -81,900
Loans and advances to banks
- reverse repos 15,076 - - 5,731 -20,807
- other 10,149 - - 10,565 -20,714
Loans and advances to customers
- reverse repos 45,767 - - 1,032 -46,799
- other 18,706 61 - 292,377 -3,849 314,993
Debt securities 39,476 110 29,757 2,912 4,932 77,187
Equity shares 2,730 285 348 3,363
Settlement balances - - - 9,630 -9,630
Derivatives 281,857 281,857
Intangible assets 7,198 7,198
Property, plant and equipment 4,874 4,874
Deferred tax 1,479 1,479
Prepayments, accrued income and
other assets - - - - -- - 4,829 4,829
A
ssets of disposal groups 89,071 89,071
413,761 456 30,105 404,147 4,932 3,849 107,451 964,701
Liabilities
Deposits by banks
- repos 18,021 - 3,591 21,612
- other 22,262 - 8,716 30,978
Customer accounts
- repos 42,296 - 2,454 44,750
- other 12,887 3,936 325,200 342,023
Debt securities in issue 4,272 7,763 29,784 41,819
Settlement balances - - 7,335 7,335
Short positions 24,561 - 24,561
Derivatives 273,589 273,589
A
ccruals, deferred income and 1,867 - 12,095 13,962
other liabilities
Retirement benefit liabilities 1,869 1,869
Deferred tax - 363 363
Subordinated liabilities - 771 18,912 19,683
Liabilities of disposal groups 80,388 80,388
397,888 12,470 397,859 94,715 902,932
Equity 61,769
964,701
For the notes to this table refer to the following page.