RBS 2014 Annual Report Download - page 55
Download and view the complete annual report
Please find page 55 of the 2014 RBS annual report below. You can navigate through the pages in the report by either clicking on the pages listed below, or by using the keyword search tool below to find specific information within the annual report.-
 1
1 -
2
-
3
-
4
-
5
-
6
-
7
-
8
-
9
-
10
-
11
-
12
-
13
-
14
-
15
-
16
-
17
-
18
-
19
-
20
-
21
-
22
-
23
-
24
-
25
-
26
-
27
-
28
-
29
-
30
-
31
-
32
-
33
-
34
-
35
-
36
-
37
-
38
-
39
-
40
-
41
-
42
-
43
-
44
-
 45
45 -
 46
46 -
 47
47 -
 48
48 -
 49
49 -
 50
50 -
 51
51 -
 52
52 -
 53
53 -
 54
54 -
 55
55 -
 56
56 -
 57
57 -
 58
58 -
 59
59 -
 60
60 -
 61
61 -
 62
62 -
 63
63 -
 64
64 -
 65
65 -
66
-
67
-
68
-
69
-
70
-
71
-
72
-
73
-
74
-
75
-
76
-
77
-
78
-
79
-
80
-
81
-
82
-
83
-
84
-
85
-
86
-
87
-
88
-
89
-
90
-
91
-
92
-
93
-
94
-
95
-
96
-
97
-
98
-
99
-
100
-
101
-
102
-
103
-
104
-
105
-
106
-
107
-
108
-
109
-
110
-
111
-
112
-
113
-
114
-
115
-
116
-
117
-
118
-
119
-
120
-
121
-
122
-
123
-
124
-
125
-
126
-
127
-
128
-
129
-
130
-
131
-
132
-
133
-
134
-
135
-
136
-
137
-
138
-
139
-
140
-
141
-
142
-
143
-
144
-
145
-
146
-
147
-
148
-
149
-
150
-
151
-
152
-
153
-
154
-
155
-
156
-
157
-
158
-
159
-
160
-
161
-
162
-
163
-
164
-
165
-
166
-
167
-
168
-
169
-
170
-
171
-
172
-
173
-
174
-
175
-
176
-
177
-
178
-
179
-
180
-
181
-
182
-
183
-
184
-
185
-
186
-
187
-
188
-
189
-
190
-
191
-
192
-
193
-
194
-
195
-
196
-
197
-
198
-
199
 |
 |

53
RBS – Interim Results 2015
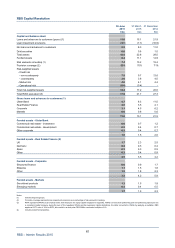
Corporate & Institutional Banking
Key points (continued)
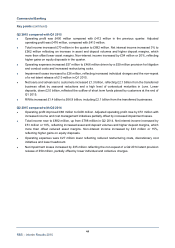
Q2 2015 compared with Q2 2014 (continued)
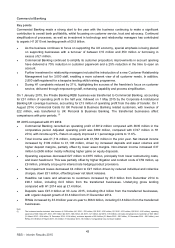
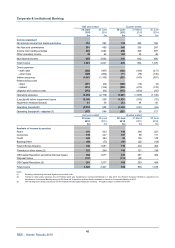
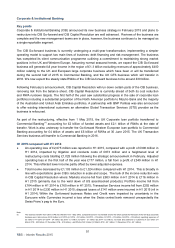
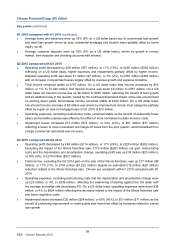
● The reduction in total income of £556 million was driven by CIB Capital Resolution, where: Markets
income fell from £282 million in Q2 2014 to £21 million in Q2 2015 (primarily due to the wind down o
f
US asset-backed products); Portfolio income was at £85 million in both periods; Transaction Services
income fell from £145 million in Q2 2014 to £104 million in Q2 2015; disposal losses of £113 million
were incurred in Q2 2015 (nil in Q2 2014). In CIB Go-forward lower Credit income was driven by the
market-wide reduction in EMEA debt capital market issuance compared to the same period last year.
● Operating expenses increased by £695 million to £1,841 million and included a £582 million increase
in restructuring costs and a £323 million increase in litigation and conduct costs. Adjusted expenses
fell by 22% reflecting the ongoing drive to reduce costs and simplify the business.
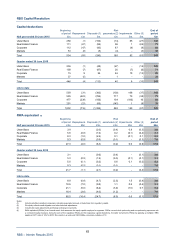
Note:
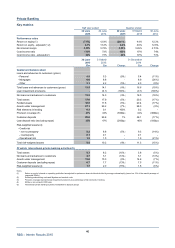
(1) The business transfer from CIB to CPB was effective from 1 May 2015. Comparatives were not restated and for the whole period the financials of the UK large corporate
business were: total income of £32 million in H1 2015 (H1 2014 - £31 million; Q2 2015 - £19 million; Q1 2015 - £15 million; Q2 2014 - £16 million); operating expenses o
f
£2 million in H1 2015 (H1 2014 - £4 million; Q2 2015 - £1 million; Q1 2015 - £1 million; Q2 2014 - £2 million); net loans and advances to customers of £2.1 billion (31
March 2015 - £2.0 billion; 31 December 2014 - £1.8 billion); and RWAs of £2.3 billion (31 March 2015 - £2.1 billion; 31 December 2014 - £2.1 billion).