RBS 2014 Annual Report Download - page 73
Download and view the complete annual report
Please find page 73 of the 2014 RBS annual report below. You can navigate through the pages in the report by either clicking on the pages listed below, or by using the keyword search tool below to find specific information within the annual report.-
 1
1 -
2
-
3
-
4
-
5
-
6
-
7
-
8
-
9
-
10
-
11
-
12
-
13
-
14
-
15
-
16
-
17
-
18
-
19
-
20
-
21
-
22
-
23
-
24
-
25
-
26
-
27
-
28
-
29
-
30
-
31
-
32
-
33
-
34
-
35
-
36
-
37
-
38
-
39
-
40
-
41
-
42
-
43
-
44
-
45
-
46
-
47
-
48
-
49
-
50
-
51
-
52
-
53
-
54
-
55
-
56
-
57
-
58
-
59
-
60
-
61
-
62
-
 63
63 -
 64
64 -
 65
65 -
 66
66 -
 67
67 -
 68
68 -
 69
69 -
 70
70 -
 71
71 -
 72
72 -
 73
73 -
 74
74 -
 75
75 -
 76
76 -
 77
77 -
 78
78 -
 79
79 -
 80
80 -
 81
81 -
 82
82 -
 83
83 -
84
-
85
-
86
-
87
-
88
-
89
-
90
-
91
-
92
-
93
-
94
-
95
-
96
-
97
-
98
-
99
-
100
-
101
-
102
-
103
-
104
-
105
-
106
-
107
-
108
-
109
-
110
-
111
-
112
-
113
-
114
-
115
-
116
-
117
-
118
-
119
-
120
-
121
-
122
-
123
-
124
-
125
-
126
-
127
-
128
-
129
-
130
-
131
-
132
-
133
-
134
-
135
-
136
-
137
-
138
-
139
-
140
-
141
-
142
-
143
-
144
-
145
-
146
-
147
-
148
-
149
-
150
-
151
-
152
-
153
-
154
-
155
-
156
-
157
-
158
-
159
-
160
-
161
-
162
-
163
-
164
-
165
-
166
-
167
-
168
-
169
-
170
-
171
-
172
-
173
-
174
-
175
-
176
-
177
-
178
-
179
-
180
-
181
-
182
-
183
-
184
-
185
-
186
-
187
-
188
-
189
-
190
-
191
-
192
-
193
-
194
-
195
-
196
-
197
-
198
-
199
 |
 |
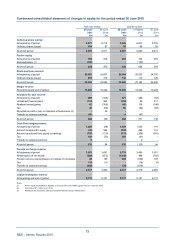
71
RBS – Interim Results 2015
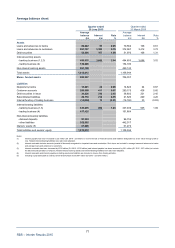
Average balance sheet
Quarter ended Quarter ended
30 June 2015 31 March 2015
Average Average
balance Interest Rate balance Interest Rate
£m £m %£m £m %
Assets
Loans and advances to banks 82,842 93 0.45 70,562 106 0.61
Loans and advances to customers 361,707 3,383 3.75 372,067 3,412 3.72
Debt securities 52,286 167 1.28 51,976 168 1.31
Interest-earning assets
- banking business (1,2,3) 496,835 3,643 2.94 494,605 3,686 3.02
- trading business (4) 149,008 154,196
Non-interest earning assets 367,169 460,143
Total assets 1,013,012 1,108,944
Memo: funded assets 696,927 706,357
Liabilities
Deposits by banks 13,021 22 0.68 14,624 24 0.67
Customer accounts 290,458 411 0.57 290,175 428 0.60
Debt securities in issue 34,336 210 2.45 36,602 221 2.45
Subordinated liabilities 20,116 218 4.35 21,820 229 4.26
Internal funding of trading business (14,836) 19 (0.51) (16,182) 33 (0.83)
Interest-bearing liabilities
- banking business (1,3) 343,095 880 1.03 347,039 935 1.09
- trading business (4) 157,425 161,864
Non-interest-bearing liabilities
- demand deposits 97,939 96,752
- other liabilities 352,685 442,017
Owners’ equity (5) 61,868 61,272
Total liabilities and owners’ equity 1,013,012 1,108,944
Notes:
(1) Interest payable has been increased by £3 million (Q1 2015 - £5 million) to record interest on financial assets and liabilities designated as at fair value through profit o
r
loss. Related interest-bearing liabilities have also been adjusted.
(2) Interest receivable includes amounts (unwind of discount) recognised on impaired loans and receivables. Such loans are included in average loans and advances to banks
and average loans and advances to customers.
(3) Interest receivable has been increased by £612 million (Q1 2015 - £610 million) and interest payable has been increased by £61 million (Q1 2015 - £57 million) to include
the discontinued operations of Citizens. Related interest-earning assets and interest-bearing liabilities have also been adjusted.
(4) Interest receivable and interest payable on trading assets and liabilities are included in income from trading activities.
(5) Including equity attributable to ordinary and B shareholders of £50,567 million (Q1 2015 - £51,675 million).