RBS 2014 Annual Report Download - page 163
Download and view the complete annual report
Please find page 163 of the 2014 RBS annual report below. You can navigate through the pages in the report by either clicking on the pages listed below, or by using the keyword search tool below to find specific information within the annual report.-
 1
1 -
2
-
3
-
4
-
5
-
6
-
7
-
8
-
9
-
10
-
11
-
12
-
13
-
14
-
15
-
16
-
17
-
18
-
19
-
20
-
21
-
22
-
23
-
24
-
25
-
26
-
27
-
28
-
29
-
30
-
31
-
32
-
33
-
34
-
35
-
36
-
37
-
38
-
39
-
40
-
41
-
42
-
43
-
44
-
45
-
46
-
47
-
48
-
49
-
50
-
51
-
52
-
53
-
54
-
55
-
56
-
57
-
58
-
59
-
60
-
61
-
62
-
63
-
64
-
65
-
66
-
67
-
68
-
69
-
70
-
71
-
72
-
73
-
74
-
75
-
76
-
77
-
78
-
79
-
80
-
81
-
82
-
83
-
84
-
85
-
86
-
87
-
88
-
89
-
90
-
91
-
92
-
93
-
94
-
95
-
96
-
97
-
98
-
99
-
100
-
101
-
102
-
103
-
104
-
105
-
106
-
107
-
108
-
109
-
110
-
111
-
112
-
113
-
114
-
115
-
116
-
117
-
118
-
119
-
120
-
121
-
122
-
123
-
124
-
125
-
126
-
127
-
128
-
129
-
130
-
131
-
132
-
133
-
134
-
135
-
136
-
137
-
138
-
139
-
140
-
141
-
142
-
143
-
144
-
145
-
146
-
147
-
148
-
149
-
150
-
151
-
152
-
 153
153 -
 154
154 -
 155
155 -
 156
156 -
 157
157 -
 158
158 -
 159
159 -
 160
160 -
 161
161 -
 162
162 -
 163
163 -
 164
164 -
 165
165 -
 166
166 -
 167
167 -
 168
168 -
 169
169 -
 170
170 -
 171
171 -
 172
172 -
 173
173 -
174
-
175
-
176
-
177
-
178
-
179
-
180
-
181
-
182
-
183
-
184
-
185
-
186
-
187
-
188
-
189
-
190
-
191
-
192
-
193
-
194
-
195
-
196
-
197
-
198
-
199
 |
 |
28
RBS – Interim Results 2015
Appendix 1 Capital and risk management
Key loan portfolios* (continued)
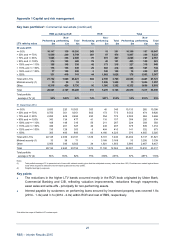
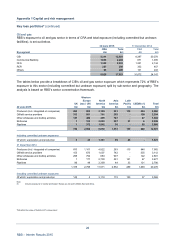
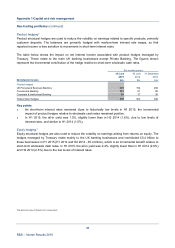
Oil and gas
RBS’s exposure to oil and gas sector in terms of CRA and total exposure (including committed but undrawn
facilities), is set out below.
30 June 2015 31 December 2014
CRA Total CR
A
Total
By segment £m £m £m £m
CIB 5,311 12,801 8,297 20,278
Commercial Banking 1,033 2,202 671 1,035
CFG 1,362 2,323 1,251 2,134
RCR 257 295 352 457
Others 63 200 101 243
8,026 17,821 10,672 24,147
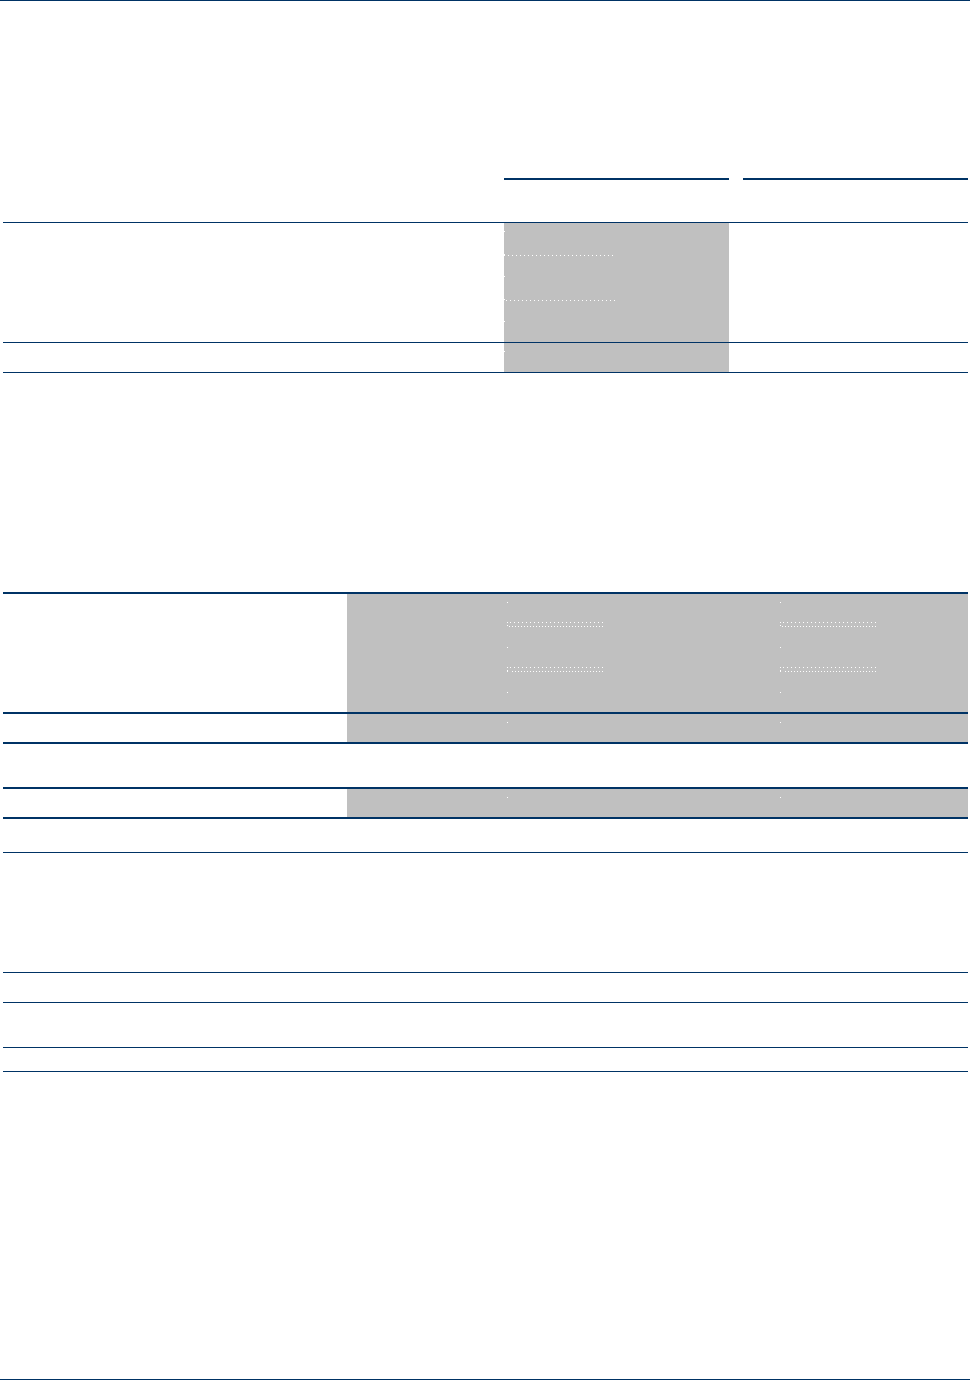
The tables below provide a breakdown of CIB’s oil and gas sector exposure which represents 72% of RBS’s
exposure to this sector (including committed but undrawn exposure) split by sub-sector and geography. The
analysis is based on RBS’s sector concentration framework.
Western
Europe North
A
sia Latin
UK (excl. UK)
A
merica
A
merica Pacific CEEMA (1) Total
30 June 2015 £m £m £m £m £m £m £m
Producers (incl. integrated oil companies) 285 903 2,129 231 118 594 4,260
Oilfield service providers 312 801 701 252 - 138 2,204
Other wholesale and trading activities 147 486 465 747 - 47 1,892
Refineries 1 102 2,022 287 21 6 2,439
Pipelines 1 372 1,542 36 - 55 2,006
746 2,664 6,859 1,553 139 840 12,801
Including committed undrawn exposures
Of which: exploration and production 5 43 1,131 99 43 - 1,321
31 December 2014
Producers (incl. integrated oil companies) 833 1,101 4,822 263 115 848 7,982
Oilfield service providers 153 675 1,007 742 - 535 3,112
Other wholesale and trading activities 295 794 683 907 - 122 2,801
Refineries 1 177 2,700 591 141 67 3,677
Pipelines 96 48 2,359 49 33 121 2,706
1,378 2,795 11,571 2,552 289 1,693 20,278
Including committed undrawn exposures
Of which: exploration and production 145 33,118 115 150 37 3,568
Note:
(1) Includes exposures to Central and Eastern Europe as well as the Middle East and Africa.
*Not within the scope of Deloitte LLP’s review report