RBS 2014 Annual Report Download - page 26
Download and view the complete annual report
Please find page 26 of the 2014 RBS annual report below. You can navigate through the pages in the report by either clicking on the pages listed below, or by using the keyword search tool below to find specific information within the annual report.-
 1
1 -
2
-
3
-
4
-
5
-
6
-
7
-
8
-
9
-
10
-
11
-
12
-
13
-
14
-
15
-
 16
16 -
 17
17 -
 18
18 -
 19
19 -
 20
20 -
 21
21 -
 22
22 -
 23
23 -
 24
24 -
 25
25 -
 26
26 -
 27
27 -
 28
28 -
 29
29 -
 30
30 -
 31
31 -
 32
32 -
 33
33 -
 34
34 -
 35
35 -
 36
36 -
37
-
38
-
39
-
40
-
41
-
42
-
43
-
44
-
45
-
46
-
47
-
48
-
49
-
50
-
51
-
52
-
53
-
54
-
55
-
56
-
57
-
58
-
59
-
60
-
61
-
62
-
63
-
64
-
65
-
66
-
67
-
68
-
69
-
70
-
71
-
72
-
73
-
74
-
75
-
76
-
77
-
78
-
79
-
80
-
81
-
82
-
83
-
84
-
85
-
86
-
87
-
88
-
89
-
90
-
91
-
92
-
93
-
94
-
95
-
96
-
97
-
98
-
99
-
100
-
101
-
102
-
103
-
104
-
105
-
106
-
107
-
108
-
109
-
110
-
111
-
112
-
113
-
114
-
115
-
116
-
117
-
118
-
119
-
120
-
121
-
122
-
123
-
124
-
125
-
126
-
127
-
128
-
129
-
130
-
131
-
132
-
133
-
134
-
135
-
136
-
137
-
138
-
139
-
140
-
141
-
142
-
143
-
144
-
145
-
146
-
147
-
148
-
149
-
150
-
151
-
152
-
153
-
154
-
155
-
156
-
157
-
158
-
159
-
160
-
161
-
162
-
163
-
164
-
165
-
166
-
167
-
168
-
169
-
170
-
171
-
172
-
173
-
174
-
175
-
176
-
177
-
178
-
179
-
180
-
181
-
182
-
183
-
184
-
185
-
186
-
187
-
188
-
189
-
190
-
191
-
192
-
193
-
194
-
195
-
196
-
197
-
198
-
199
 |
 |

24
RBS – Interim Results 2015
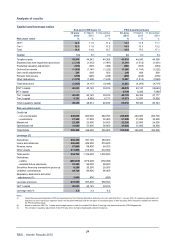
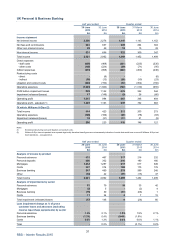
Analysis of results
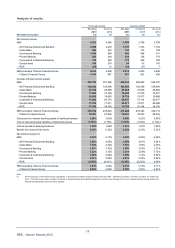
Capital and leverage ratios
End-point CRR basis (1) PRA transitional basis
30 June 31 March 31 December 30 June 31 March 31 December
2015 2015 2014 2015 2015 2014
Risk asset ratios % %% % % %
CET1 12.3 11.5 11.2 12.3 11.5 11.1
Tier 1 12.3 11.5 11.2 14.3 13.3 13.2
Total 14.8 14.0 13.7 18.5 17.0 17.1
Capital £m £m £m £m £m £m
Tangible equity 43,919 44,242 44,368 43,919 44,242 44,368
Expected loss less impairment provisions (1,319) (1,512) (1,491) (1,319) (1,512) (1,491)
Prudential valuation adjustment (366) (393) (384) (366) (393) (384)
Deferred tax assets (1,206) (1,140) (1,222) (1,206) (1,140) (1,222)
Own credit adjustments 345 609 500 345 609 500
Pension fund assets (250) (245) (238) (250) (245) (238)
Other deductions (1,070) (1,436) (1,614) (1,047) (1,414) (1,884)
Total deductions (3,866) (4,117) (4,449) (3,843) (4,095) (4,719)
CET1 capital 40,053 40,125 39,919 40,076 40,147 39,649
A
T1 capital - -- 6,709 6,206 7,468
Tier 1 capital 40,053 40,125 39,919 46,785 46,353 47,117
Tier 2 capital 8,181 8,689 8,717 13,573 12,970 13,626
Total regulatory capital 48,234 48,814 48,636 60,358 59,323 60,743
Risk-weighted assets
Credit risk
- non-counterparty 245,000 263,000 264,700 245,000 263,000 264,700
- counterparty 27,500 31,200 30,400 27,500 31,200 30,400
Market risk 22,300 22,800 24,000 22,300 22,800 24,000
Operational risk 31,600 31,600 36,800 31,600 31,600 36,800
Total RWAs 326,400 348,600 355,900 326,400 348,600 355,900
Leverage (2)
Derivatives 282,300 391,100 354,000
Loans and advances 402,800 429,400 419,600
Reverse repos 67,800 69,900 64,700
Other assets 211,800 214,200 212,500
Total assets 964,700 1,104,600 1,050,800
Derivatives
- netting (266,600) (379,200) (330,900)
- potential future exposures 83,500 96,000 98,800
Securities financing transactions gross up 6,200 20,200 25,000
Undrawn commitments 84,700 94,900 96,400
Regulatory deductions and other
adjustments (3) 2,000 900 (600)
Leverage exposure 874,500 937,400 939,500
CET1 capital 40,053 40,125 39,919
Leverage ratio % 4.6 4.3 4.2
Notes:
(1) Capital Requirements Regulation (CRR) as implemented by the Prudential Regulation Authority in the UK, with effect from 1 January 2014. All regulatory adjustments and
deductions to CET1 have been applied in full for the end-point CRR basis with the exception of unrealised gains on AFS securities which has been included from 2015 fo
r
the PRA transitional basis.
(2) Based on end-point CRR Tier 1 capital and leverage exposure under the revised 2014 Basel III leverage ratio framework and the CRR Delegated Act.
(3) The increase in regulatory adjustments in Q2 2015 was driven by higher disallowable settlement balances.