RBS 2014 Annual Report Download - page 153
Download and view the complete annual report
Please find page 153 of the 2014 RBS annual report below. You can navigate through the pages in the report by either clicking on the pages listed below, or by using the keyword search tool below to find specific information within the annual report.-
 1
1 -
2
-
3
-
4
-
5
-
6
-
7
-
8
-
9
-
10
-
11
-
12
-
13
-
14
-
15
-
16
-
17
-
18
-
19
-
20
-
21
-
22
-
23
-
24
-
25
-
26
-
27
-
28
-
29
-
30
-
31
-
32
-
33
-
34
-
35
-
36
-
37
-
38
-
39
-
40
-
41
-
42
-
43
-
44
-
45
-
46
-
47
-
48
-
49
-
50
-
51
-
52
-
53
-
54
-
55
-
56
-
57
-
58
-
59
-
60
-
61
-
62
-
63
-
64
-
65
-
66
-
67
-
68
-
69
-
70
-
71
-
72
-
73
-
74
-
75
-
76
-
77
-
78
-
79
-
80
-
81
-
82
-
83
-
84
-
85
-
86
-
87
-
88
-
89
-
90
-
91
-
92
-
93
-
94
-
95
-
96
-
97
-
98
-
99
-
100
-
101
-
102
-
103
-
104
-
105
-
106
-
107
-
108
-
109
-
110
-
111
-
112
-
113
-
114
-
115
-
116
-
117
-
118
-
119
-
120
-
121
-
122
-
123
-
124
-
125
-
126
-
127
-
128
-
129
-
130
-
131
-
132
-
133
-
134
-
135
-
136
-
137
-
138
-
139
-
140
-
141
-
142
-
 143
143 -
 144
144 -
 145
145 -
 146
146 -
 147
147 -
 148
148 -
 149
149 -
 150
150 -
 151
151 -
 152
152 -
 153
153 -
 154
154 -
 155
155 -
 156
156 -
 157
157 -
 158
158 -
 159
159 -
 160
160 -
 161
161 -
 162
162 -
 163
163 -
164
-
165
-
166
-
167
-
168
-
169
-
170
-
171
-
172
-
173
-
174
-
175
-
176
-
177
-
178
-
179
-
180
-
181
-
182
-
183
-
184
-
185
-
186
-
187
-
188
-
189
-
190
-
191
-
192
-
193
-
194
-
195
-
196
-
197
-
198
-
199
 |
 |

18
RBS – Interim Results 2015
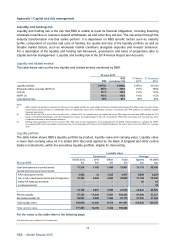
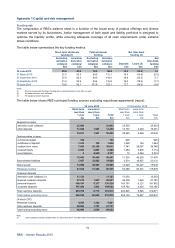
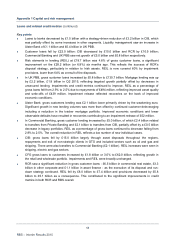
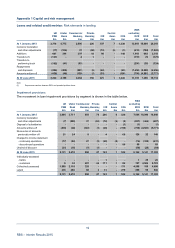
Appendix 1 Capital and risk management
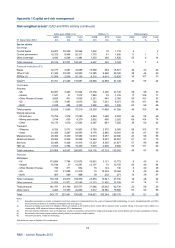
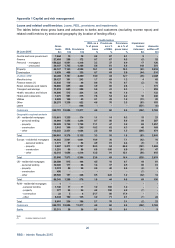
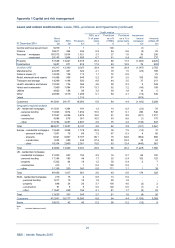
Loans and related credit metrics (continued)
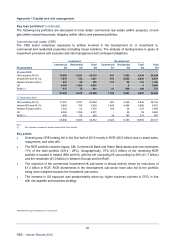
Key points
• Loans to banks decreased by £1.5 billion with a strategy-driven reduction of £3.2 billion in CIB, which
was partially offset by some increases in other segments. Liquidity management saw an increase in
Ulster Bank of £1.1 billion and £0.4 billion in UK PBB.
• Customer loans fell by £22.0 billion: CIB decreased by £15.0 billion and RCR by £10.9 billion;
Commercial Banking and UK PBB saw net growth of £5.0 billion and £0.8 billion respectively.
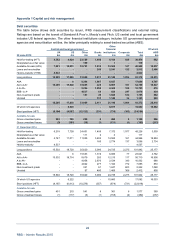
• Risk elements in lending (REIL) at £18.7 billion was 4.8% of gross customer loans, a significan
t
improvement on the £28.2 billion (or 6.8%) six months ago. This reflects the success of RCR’s
disposal strategy, particularly in relation to Irish assets. REIL is now covered 60% by impairment
provisions, lower than 64% as a result of the disposals.
• In UK PBB, gross customer loans increased by £0.8 billion to £130.7 billion. Mortgage lending was up
by £2.2 billion, £1.8 billion in Q2 2015, reflecting targeted growth partially offset by decreases in
unsecured lending. Impairments and credit metrics continued to improve. REIL as a percentage o
f
gross loans fell from 2.9% to 2.5% due to repayments of £494 million, reflecting improved asset quality
and write-offs of £439 million. Impairment release reflected recoveries on the back of improved
economic conditions.
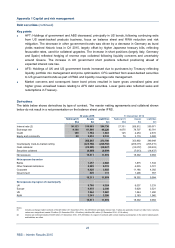
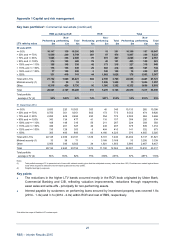
• Ulster Bank: gross customers lending was £2.1 billion lower primarily driven by the weakening euro.
Significant growth in new lending volumes was more than offset by continued customer deleveraging
including a reduction in the tracker mortgage portfolio. Improved economic conditions and lowe
r
observable defaults have resulted in recoveries contributing to an impairment release of £52 million.
• In Commercial Banking, gross customer lending increased by £5.0 billion, of which £2.4 billion related
to transfers from Private Banking and £2.1 billion to transfers from CIB, partially offset by a £0.5 billion
decrease in legacy portfolios. REIL as a percentage of gross loans continued to decrease falling from
2.9% to 2.5%. The overall reduction in REIL reflects a low number of new individual cases.
• CIB: gross loans fell by £15.0 billion largely through asset disposals throughout the regions,
repayments and exit of non-strategic clients in GTS and included sectors such as oil and gas and
shipping. There were also transfers to Commercial Banking (£2.1 billion). REIL increases were seen in
shipping, electric and gas sectors.
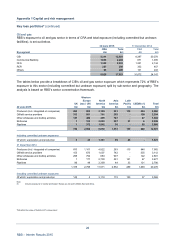
• CFG gross loans to customers increased by £1.8 billion or 3.0% to £62.0 billion, reflecting growth in
the retail and wholesale portfolio. Impairments and REIL were broadly unchanged.
• RCR saw a significant reduction in gross customer loans - £6.5 billion in commercial real estate, £3.3
billion in other corporate and £1.1 billion in asset finance - as the execution of its disposal and run-
down strategy continued. REIL fell by £8.0 billion to £7.4 billion and provisions decreased by £5.8
billion to £5.1 billion as a consequence. This contributed to the significant improvements in credit
metrics in both RCR and RBS overall.