RBS 2014 Annual Report Download - page 97
Download and view the complete annual report
Please find page 97 of the 2014 RBS annual report below. You can navigate through the pages in the report by either clicking on the pages listed below, or by using the keyword search tool below to find specific information within the annual report.-
 1
1 -
2
-
3
-
4
-
5
-
6
-
7
-
8
-
9
-
10
-
11
-
12
-
13
-
14
-
15
-
16
-
17
-
18
-
19
-
20
-
21
-
22
-
23
-
24
-
25
-
26
-
27
-
28
-
29
-
30
-
31
-
32
-
33
-
34
-
35
-
36
-
37
-
38
-
39
-
40
-
41
-
42
-
43
-
44
-
45
-
46
-
47
-
48
-
49
-
50
-
51
-
52
-
53
-
54
-
55
-
56
-
57
-
58
-
59
-
60
-
61
-
62
-
63
-
64
-
65
-
66
-
67
-
68
-
69
-
70
-
71
-
72
-
73
-
74
-
75
-
76
-
77
-
78
-
79
-
80
-
81
-
82
-
83
-
84
-
85
-
86
-
 87
87 -
 88
88 -
 89
89 -
 90
90 -
 91
91 -
 92
92 -
 93
93 -
 94
94 -
 95
95 -
 96
96 -
 97
97 -
 98
98 -
 99
99 -
 100
100 -
 101
101 -
 102
102 -
 103
103 -
 104
104 -
 105
105 -
 106
106 -
 107
107 -
108
-
109
-
110
-
111
-
112
-
113
-
114
-
115
-
116
-
117
-
118
-
119
-
120
-
121
-
122
-
123
-
124
-
125
-
126
-
127
-
128
-
129
-
130
-
131
-
132
-
133
-
134
-
135
-
136
-
137
-
138
-
139
-
140
-
141
-
142
-
143
-
144
-
145
-
146
-
147
-
148
-
149
-
150
-
151
-
152
-
153
-
154
-
155
-
156
-
157
-
158
-
159
-
160
-
161
-
162
-
163
-
164
-
165
-
166
-
167
-
168
-
169
-
170
-
171
-
172
-
173
-
174
-
175
-
176
-
177
-
178
-
179
-
180
-
181
-
182
-
183
-
184
-
185
-
186
-
187
-
188
-
189
-
190
-
191
-
192
-
193
-
194
-
195
-
196
-
197
-
198
-
199
 |
 |
95
RBS – Interim Results 2015
Notes
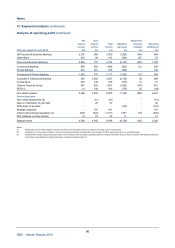
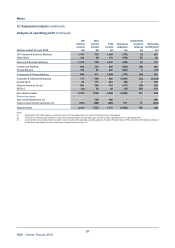
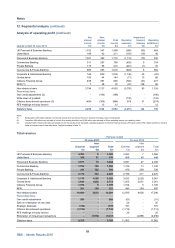
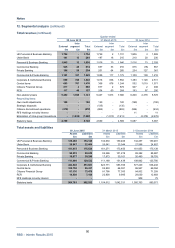
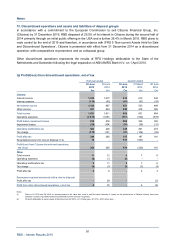
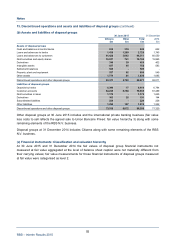
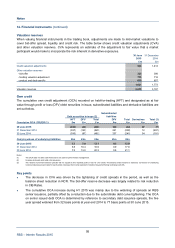
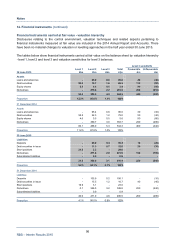
14. Financial instruments (continued)
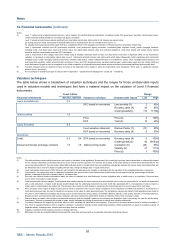
Valuation reserves
When valuing financial instruments in the trading book, adjustments are made to mid-market valuations to
cover bid-offer spread, liquidity and credit risk. The table below shows credit valuation adjustments (CVA)
and other valuation reserves. CVA represents an estimate of the adjustment to fair value that a market
participant would make to incorporate the risk inherent in derivative exposures.
30 June 31 Decembe
r
2015 2014
£m £m
Credit valuation adjustments 998 1,414
Other valuation reserves
- bid-offer 326 398
- funding valuation adjustment 716 718
- product and deal specific 639 657
1,681 1,773
Valuation reserves 2,679 3,187
Own credit
The cumulative own credit adjustment (OCA) recorded on held-for-trading (HFT) and designated as at fair
value through profit or loss (DFV) debt securities in issue, subordinated liabilities and derivative liabilities are
set out below.
Subordinated
Debt securities in issue (2) liabilities
HFT DFV Total DFV Total Derivatives Total (3)
Cumulative OCA (CR)/DR (1) £m £m £m £m £m £m £m
30 June 2015 (223) (23) (246) 182 (64) 57 (7)
31 December 2014 (397) (123) (520) 221 (299) 12 (287)
30 June 2014 (395) (87) (482) 237 (245) 54 (191)
Carrying values of underlying liabilities £bn £bn £bn £bn £bn
30 June 2015 4.3 7.8 12.1 0.8 12.9
31 December 2014 6.5 10.4 16.9 0.9 17.8
30 June 2014 7.3 13.0 20.3 0.8 21.1
Notes:
(1) The OCA does not alter cash flows and is not used for performance management.
(2) Includes wholesale and retail note issuances.
(3) The reserve movement between periods will not equate to the reported profit or loss for own credit. The balance sheet reserve is stated by conversion of underlying
currency balances at spot rates for each period, whereas the income statement includes intra-period foreign exchange sell-offs.
Key points
• The decrease in CVA was driven by the tightening of credit spreads in the period, as well as the
balance sheet reduction in RCR. The bid-offer reserve decrease was largely related to risk reduction
in CIB Rates.
• The cumulative OCA increase during H1 2015 was mainly due to the widening of spreads on RBS
senior issuance, partially offset by a reduction due to the subordinate debt curve tightening. The OC
A
on senior issued debt OCA is determined by reference to secondary debt issuance spreads, the five
year spread widened from 32 basis points at year end 2014 to 77 basis points at 30 June 2015.