RBS 2014 Annual Report Download - page 46
Download and view the complete annual report
Please find page 46 of the 2014 RBS annual report below. You can navigate through the pages in the report by either clicking on the pages listed below, or by using the keyword search tool below to find specific information within the annual report.-
 1
1 -
2
-
3
-
4
-
5
-
6
-
7
-
8
-
9
-
10
-
11
-
12
-
13
-
14
-
15
-
16
-
17
-
18
-
19
-
20
-
21
-
22
-
23
-
24
-
25
-
26
-
27
-
28
-
29
-
30
-
31
-
32
-
33
-
34
-
35
-
 36
36 -
 37
37 -
 38
38 -
 39
39 -
 40
40 -
 41
41 -
 42
42 -
 43
43 -
 44
44 -
 45
45 -
 46
46 -
 47
47 -
 48
48 -
 49
49 -
 50
50 -
 51
51 -
 52
52 -
 53
53 -
 54
54 -
 55
55 -
 56
56 -
57
-
58
-
59
-
60
-
61
-
62
-
63
-
64
-
65
-
66
-
67
-
68
-
69
-
70
-
71
-
72
-
73
-
74
-
75
-
76
-
77
-
78
-
79
-
80
-
81
-
82
-
83
-
84
-
85
-
86
-
87
-
88
-
89
-
90
-
91
-
92
-
93
-
94
-
95
-
96
-
97
-
98
-
99
-
100
-
101
-
102
-
103
-
104
-
105
-
106
-
107
-
108
-
109
-
110
-
111
-
112
-
113
-
114
-
115
-
116
-
117
-
118
-
119
-
120
-
121
-
122
-
123
-
124
-
125
-
126
-
127
-
128
-
129
-
130
-
131
-
132
-
133
-
134
-
135
-
136
-
137
-
138
-
139
-
140
-
141
-
142
-
143
-
144
-
145
-
146
-
147
-
148
-
149
-
150
-
151
-
152
-
153
-
154
-
155
-
156
-
157
-
158
-
159
-
160
-
161
-
162
-
163
-
164
-
165
-
166
-
167
-
168
-
169
-
170
-
171
-
172
-
173
-
174
-
175
-
176
-
177
-
178
-
179
-
180
-
181
-
182
-
183
-
184
-
185
-
186
-
187
-
188
-
189
-
190
-
191
-
192
-
193
-
194
-
195
-
196
-
197
-
198
-
199
 |
 |

44
RBS – Interim Results 2015
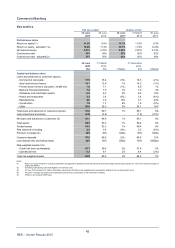
Commercial Banking
Key points (continued)
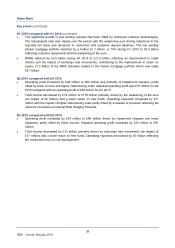
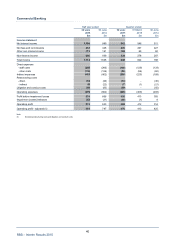
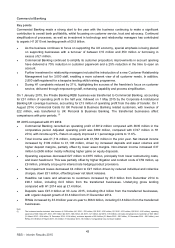
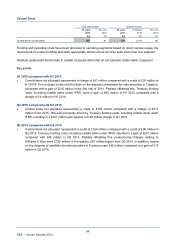
Q2 2015 compared with Q1 2015
• Operating profit was £400 million compared with £412 million in the previous quarter. Adjusted
operating profit was £476 million, compared with £413 million.
• Total income increased £70 million in the quarter to £892 million. Net interest income increased 3% to
£562 million reflecting an increase in asset and deposit volumes and higher deposit margins, which
more than offset lower asset margins. Non-interest income increased by £54 million or 20%, reflecting
higher gains on equity disposals in the quarter.
• Operating expenses increased £57 million to £466 million driven by a £59 million provision for litigation
and conduct costs and increased restructuring costs.
• Impairment losses increased to £26 million, reflecting increased individual charges and the non-repeat
of a net latent release of £13 million in Q1 2015.
• Net loans and advances to customers increased £1.3 billion, reflecting £2.1 billion from the transferred
business offset by seasonal reductions and a high level of contractual maturities in June. Lowe
r
deposits, down £2.0 billion, reflected the outflow of short term funds placed by customers at the end o
f
Q1 2015.
• RWAs increased £1.4 billion to £66.9 billion, including £2.1 billion from the transferred businesses.
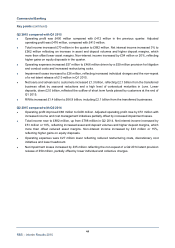
Q2 2015 compared with Q2 2014
• Operating profit improved £86 million to £400 million. Adjusted operating profit rose by £51 million with
increased income and cost management initiatives partially offset by increased impairment losses.
• Total income rose to £892 million, up from £798 million in Q2 2014. Net interest income increased b
y
£51 million or 10%, reflecting increased asset and deposit volumes and higher deposit margins, which
more than offset reduced asset margins. Non-interest income increased by £43 million or 15%,
reflecting higher gains on equity disposals.
• Operating expenses were £27 million lower reflecting reduced restructuring costs, discretionary cos
t
initiatives and lower headcount.
• Net impairment losses increased by £35 million reflecting the non-repeat of a Q2 2014 latent provision
release of £59 million, partially offset by lower individual and collective charges.