RBS 2014 Annual Report Download - page 58
Download and view the complete annual report
Please find page 58 of the 2014 RBS annual report below. You can navigate through the pages in the report by either clicking on the pages listed below, or by using the keyword search tool below to find specific information within the annual report.-
 1
1 -
2
-
3
-
4
-
5
-
6
-
7
-
8
-
9
-
10
-
11
-
12
-
13
-
14
-
15
-
16
-
17
-
18
-
19
-
20
-
21
-
22
-
23
-
24
-
25
-
26
-
27
-
28
-
29
-
30
-
31
-
32
-
33
-
34
-
35
-
36
-
37
-
38
-
39
-
40
-
41
-
42
-
43
-
44
-
45
-
46
-
47
-
 48
48 -
 49
49 -
 50
50 -
 51
51 -
 52
52 -
 53
53 -
 54
54 -
 55
55 -
 56
56 -
 57
57 -
 58
58 -
 59
59 -
 60
60 -
 61
61 -
 62
62 -
 63
63 -
 64
64 -
 65
65 -
 66
66 -
 67
67 -
 68
68 -
69
-
70
-
71
-
72
-
73
-
74
-
75
-
76
-
77
-
78
-
79
-
80
-
81
-
82
-
83
-
84
-
85
-
86
-
87
-
88
-
89
-
90
-
91
-
92
-
93
-
94
-
95
-
96
-
97
-
98
-
99
-
100
-
101
-
102
-
103
-
104
-
105
-
106
-
107
-
108
-
109
-
110
-
111
-
112
-
113
-
114
-
115
-
116
-
117
-
118
-
119
-
120
-
121
-
122
-
123
-
124
-
125
-
126
-
127
-
128
-
129
-
130
-
131
-
132
-
133
-
134
-
135
-
136
-
137
-
138
-
139
-
140
-
141
-
142
-
143
-
144
-
145
-
146
-
147
-
148
-
149
-
150
-
151
-
152
-
153
-
154
-
155
-
156
-
157
-
158
-
159
-
160
-
161
-
162
-
163
-
164
-
165
-
166
-
167
-
168
-
169
-
170
-
171
-
172
-
173
-
174
-
175
-
176
-
177
-
178
-
179
-
180
-
181
-
182
-
183
-
184
-
185
-
186
-
187
-
188
-
189
-
190
-
191
-
192
-
193
-
194
-
195
-
196
-
197
-
198
-
199
 |
 |

56
RBS – Interim Results 2015
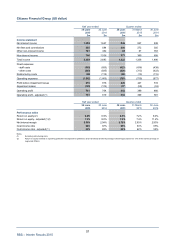
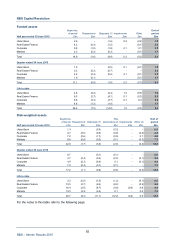
Citizens Financial Group (£ Sterling)
30 June 31 March 31 Decembe
r
2015 2015 2014
£bn £bn Change £bn Change
Capital and balance sheet
Loans and advances to customers (gross) 61.9 64.0 (3%) 60.1 3%
Loan impairment provisions (0.5) (0.6) (17%) (0.5) -
Net loans and advances to customers 61.4 63.4 (3%) 59.6 3%
Total assets 87.2 91.8 (5%) 84.9 3%
Funded assets 86.8 91.3 (5%) 84.5 3%
Investment securities 16.0 16.9 (5%) 15.8 1%
Risk elements in lending 1.2 1.4 (14%) 1.3 (8%)
Provision coverage (1) 43% 41% 200bp 40% 300bp
Customer deposits (excluding repos) 63.8 65.8 (3%) 60.6 5%
Bank deposits (excluding repos) 4.5 5.1 (12%) 5.1 (12%)
Loan:deposit ratio (excluding repos) 96% 96% -98% (200bp)
Risk-weighted assets (2)
- Credit risk
- non-counterparty 64.0 66.1 (3%) 62.4 3%
- counterparty 0.9 1.0 (10%) 0.9 -
- Operational risk 4.9 4.9 - 5.1 (4%)
Total risk-weighted assets 69.8 72.0 (3%) 68.4 2%
Spot exchange rate - US$/£ 1.572 1.485 1.562
Notes:
(1) Provision coverage represents loan impairment provisions as a percentage of risk elements in lending.
(2) RWAs on an end-point CRR basis.
Key points
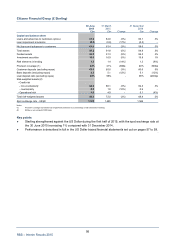
● Sterling strengthened against the US Dollar during the first half of 2015, with the spot exchange rate at
the 30 June 2015 increasing 1% compared with 31 December 2014.
● Performance is described in full in the US Dollar based financial statements set out on pages 57 to 59.
don