RBS 2014 Annual Report Download - page 177
Download and view the complete annual report
Please find page 177 of the 2014 RBS annual report below. You can navigate through the pages in the report by either clicking on the pages listed below, or by using the keyword search tool below to find specific information within the annual report.-
 1
1 -
2
-
3
-
4
-
5
-
6
-
7
-
8
-
9
-
10
-
11
-
12
-
13
-
14
-
15
-
16
-
17
-
18
-
19
-
20
-
21
-
22
-
23
-
24
-
25
-
26
-
27
-
28
-
29
-
30
-
31
-
32
-
33
-
34
-
35
-
36
-
37
-
38
-
39
-
40
-
41
-
42
-
43
-
44
-
45
-
46
-
47
-
48
-
49
-
50
-
51
-
52
-
53
-
54
-
55
-
56
-
57
-
58
-
59
-
60
-
61
-
62
-
63
-
64
-
65
-
66
-
67
-
68
-
69
-
70
-
71
-
72
-
73
-
74
-
75
-
76
-
77
-
78
-
79
-
80
-
81
-
82
-
83
-
84
-
85
-
86
-
87
-
88
-
89
-
90
-
91
-
92
-
93
-
94
-
95
-
96
-
97
-
98
-
99
-
100
-
101
-
102
-
103
-
104
-
105
-
106
-
107
-
108
-
109
-
110
-
111
-
112
-
113
-
114
-
115
-
116
-
117
-
118
-
119
-
120
-
121
-
122
-
123
-
124
-
125
-
126
-
127
-
128
-
129
-
130
-
131
-
132
-
133
-
134
-
135
-
136
-
137
-
138
-
139
-
140
-
141
-
142
-
143
-
144
-
145
-
146
-
147
-
148
-
149
-
150
-
151
-
152
-
153
-
154
-
155
-
156
-
157
-
158
-
159
-
160
-
161
-
162
-
163
-
164
-
165
-
166
-
 167
167 -
 168
168 -
 169
169 -
 170
170 -
 171
171 -
 172
172 -
 173
173 -
 174
174 -
 175
175 -
 176
176 -
 177
177 -
 178
178 -
 179
179 -
 180
180 -
 181
181 -
 182
182 -
 183
183 -
 184
184 -
 185
185 -
 186
186 -
 187
187 -
188
-
189
-
190
-
191
-
192
-
193
-
194
-
195
-
196
-
197
-
198
-
199
 |
 |
42
RBS – Interim Results 2015
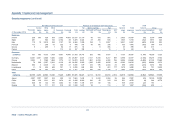
Appendix 1 Capital and risk management
Country risk: Country exposures
Net balance sheet exposure Analysis of net balance sheet exposures Off- CDS
Central Othe
r
Othe
r
Net Debt securities Net balance Total notional less Gross
Sovereign banks banks FI Corporate Personal Total lending
A
FS/LAR HFT (net) Derivatives SFT sheet exposure fair value Derivatives SFT
30 June 2015 £m £m £m £m £m £m £m £m £m £m £m £m £m £m £m £m £m
Eurozone
Ireland 292 1,326 541 732 4,174 13,116 20,181 18,959 20 511 691 -2,429 22,610 (38) 2,001 1,384
Spain (168) 1 447 44 1,683 77 2,084 1,579 -(175) 677 31,449 3,533 (294) 2,959 608
Italy (1,338) 12 1,583 262 527 25 1,071 612 23 (1,356) 1,790 21,303 2,374 (483) 6,231 2,020
Portugal (41) - 165 73 263 7 467 226 18 (2) 225 -185 652 (104) 261 199
Greece 6 - 3 1 80 20 110 64 -6 40 -21 131 (33) 40 -
Cyprus - - - - 44 14 58 43 -- 15 -12 70 - 15 -
Eurozone
periphery (1,249) 1,339 2,739 1,112 6,771 13,259 23,971 21,483 61 (1,016) 3,438 55,399 29,370 (952) 11,507 4,211
Germany 5,509 6,538 3,175 5,149 1,871 83 22,325 8,092 6,377 (38) 7,650 244 5,168 27,493 (2,320) 31,029 6,690
France 5,775 2 8,048 1,505 1,965 83 17,378 4,306 2,404 3,929 6,418 321 7,562 24,940 (2,452) 32,703 18,824
Netherlands 612 803 3,964 5,687 1,751 31 12,848 3,061 1,079 3,356 5,333 19 7,940 20,788 (716) 16,213 1,937
Belgium 1,234 - 2,085 54 302 22 3,697 442 539 642 1,956 118 774 4,471 (161) 2,446 942
Luxembourg - 23 254 1,043 999 7 2,326 1,584 309 48 368 17 1,182 3,508 (21) 500 2,461
Other 1,851 11 817 67 268 18 3,032 400 275 1,424 864 69 810 3,842 (523) 3,514 210
Total
eurozone 13,732 8,716 21,082 14,617 13,927 13,503 85,577 39,368 11,044 8,345 26,027 793 28,835 114,412 (7,145) 97,912 35,275
Japan 7,377 1,968 1,324 550 99 31 11,349 2,334 -7,200 1,795 20 626 11,975 (26) 7,532 2,752
China 156 169 954 200 847 32 2,358 1,982 90 - 255 31 152 2,510 21 359 6,131
India 476 60 44 199 867 34 1,680 1,153 367 109 51 -545 2,225 (45) 111 63
Russia 8 11 661 39 854 45 1,618 1,545 8(3) 68 -91 1,709 (101) 83 -
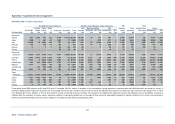
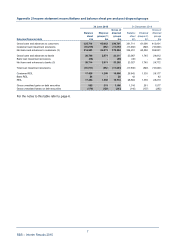
These tables show RBS exposure at 30 June 2015 and 31 December 2014 by country of operation of the counterparty, except exposures to governments and individuals which are shown by country of
residence. Balance sheet exposures are shown net of loan impairment provisions. Countries shown are those where the balance sheet exposure exceeded £1 billion and which had ratings of A+ or below
from Standard and Poor’s, Moody’s or Fitch at 30 June 2015, as well as selected eurozone countries. The exposures are stated before taking into account risk mitigants, such as guarantees, insurance or
collateral (with the exception of reverse repos). Exposures relating to ocean-going vessels are not included as they cannot be meaningfully assigned to specific countries from a country risk perspective.
Refer to the 2014 Annual Report and Accounts for definitions, including securities financing transactions (SFT).