RBS 2014 Annual Report Download - page 164
Download and view the complete annual report
Please find page 164 of the 2014 RBS annual report below. You can navigate through the pages in the report by either clicking on the pages listed below, or by using the keyword search tool below to find specific information within the annual report.-
 1
1 -
2
-
3
-
4
-
5
-
6
-
7
-
8
-
9
-
10
-
11
-
12
-
13
-
14
-
15
-
16
-
17
-
18
-
19
-
20
-
21
-
22
-
23
-
24
-
25
-
26
-
27
-
28
-
29
-
30
-
31
-
32
-
33
-
34
-
35
-
36
-
37
-
38
-
39
-
40
-
41
-
42
-
43
-
44
-
45
-
46
-
47
-
48
-
49
-
50
-
51
-
52
-
53
-
54
-
55
-
56
-
57
-
58
-
59
-
60
-
61
-
62
-
63
-
64
-
65
-
66
-
67
-
68
-
69
-
70
-
71
-
72
-
73
-
74
-
75
-
76
-
77
-
78
-
79
-
80
-
81
-
82
-
83
-
84
-
85
-
86
-
87
-
88
-
89
-
90
-
91
-
92
-
93
-
94
-
95
-
96
-
97
-
98
-
99
-
100
-
101
-
102
-
103
-
104
-
105
-
106
-
107
-
108
-
109
-
110
-
111
-
112
-
113
-
114
-
115
-
116
-
117
-
118
-
119
-
120
-
121
-
122
-
123
-
124
-
125
-
126
-
127
-
128
-
129
-
130
-
131
-
132
-
133
-
134
-
135
-
136
-
137
-
138
-
139
-
140
-
141
-
142
-
143
-
144
-
145
-
146
-
147
-
148
-
149
-
150
-
151
-
152
-
153
-
 154
154 -
 155
155 -
 156
156 -
 157
157 -
 158
158 -
 159
159 -
 160
160 -
 161
161 -
 162
162 -
 163
163 -
 164
164 -
 165
165 -
 166
166 -
 167
167 -
 168
168 -
 169
169 -
 170
170 -
 171
171 -
 172
172 -
 173
173 -
 174
174 -
175
-
176
-
177
-
178
-
179
-
180
-
181
-
182
-
183
-
184
-
185
-
186
-
187
-
188
-
189
-
190
-
191
-
192
-
193
-
194
-
195
-
196
-
197
-
198
-
199
 |
 |

29
RBS – Interim Results 2015
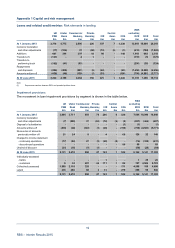
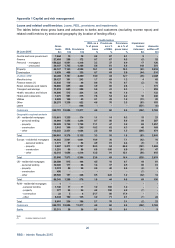
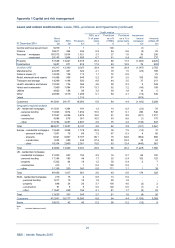
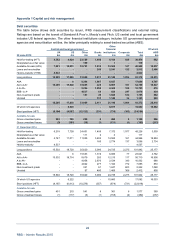
Appendix 1 Capital and risk management
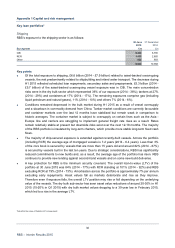
Key loan portfolios*: Oil and gas (continued)
Key points
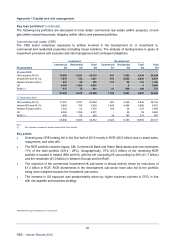
• Overall exposure decreased by £2.6 billion (CRA) and £6.3 billion (total exposure), in line with strategy
as a result of active portfolio management and asset disposals, principally in CIB. The small increase in
CPB reflected transfers from CIB.
• The price of crude oil recovered from a low of US$45 per barrel in January 2015 to US$61 per barrel at
30 June 2015. The price of natural gas is not highly correlated to oil prices and is determined
regionally. US natural gas prices have been relatively stable compared with the recent price of crude
oil.
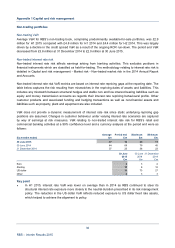
• Exposures continue to be closely managed through ongoing customer and sub-sector reviews, and
stress testing. Risk appetite was reduced during 2014 with further reductions in 2015 (in part due to
asset disposals). Further stress analysis of the portfolio was carried out in 2015 and limits were again
reduced with a continued focus on ensuring that the portfolio remains heavily weighted towards
investment grade customers. As part of the bank’s strategic review, limits for Americas and Asia-Pacific
have been significantly reduced.
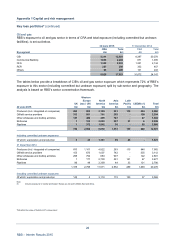
• The sub-sector in which a customer operates is a primary consideration for assessing credit risk.
Current areas of focus for stress testing and more active credit risk management include those
customers involved in exploration and production (E&P) and oilfield service providers. E&P customers
represent approximately 10% of CIB’s exposure to the oil and gas sector.
• Customers involved in E&P are most immediately exposed to the oil price decline. At 30 June 2015,
97% of these were within the producers sub-sector. Companies involved in this area have already
introduced capital spending reductions to conserve cash. In turn, this reduced spending is likely to
have an adverse impact on oilfield service providers. This is due to the E&P companies buying less
products and services from the oilfield service providers, and demanding lower prices for those they do
purchase.
• The other principal components of CIB’s exposure to producers are Integrated Oil Companies (IOCs)
and National Oil Companies (NOCs). IOCs and NOCs are less vulnerable to the oil price decline due to
scale, diversification and in the case of NOC, explicit support from governments.
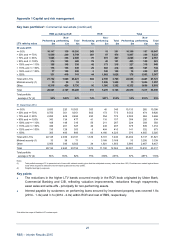
• At 30 June 2015 78% (2014 - 83%) of the CIB total portfolio exposure was investment grade (AQ1-
AQ4 or equivalent to BBB- and above).
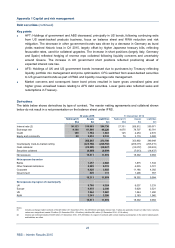
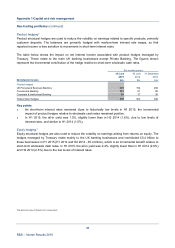
• The committed lending exposure included legal commitments to syndicated bank facilities, with tenors
up to five years. These committed facilities are for general corporate purposes - including funding
operating needs and capital expenditures - and are available as long as counterparties comply with the
terms of the credit agreement. Contingent obligations relate to guarantees, letters of credit and
suretyships provided to customers.
• RBS had no high-yield bond or loan underwriting positions as at 30 June 2015 (2014 - US$86 million
high-yield loan underwritings in the Americas).
• There has been a small number of forbearance events, usually involving the relaxation of financial
covenants to give customers more financial flexibility. Most forbearance has involved customers in the
E&P and oilfield services sub-sectors where earnings have been more immediately and materially
impacted by the downturn.
• At 30 June 2015, Watchlist Red (performing customers who show signs of declining creditworthiness
and so require active management) outside RCR totalled £310 million (2014 - £88 million), of which
£98 million (2014 - £5 million) was managed by Restructuring.
*Not within the scope of Deloitte LLP’s review report